What Is Liquidity in ICT Trading? Pools, Ranges, and Sweeps
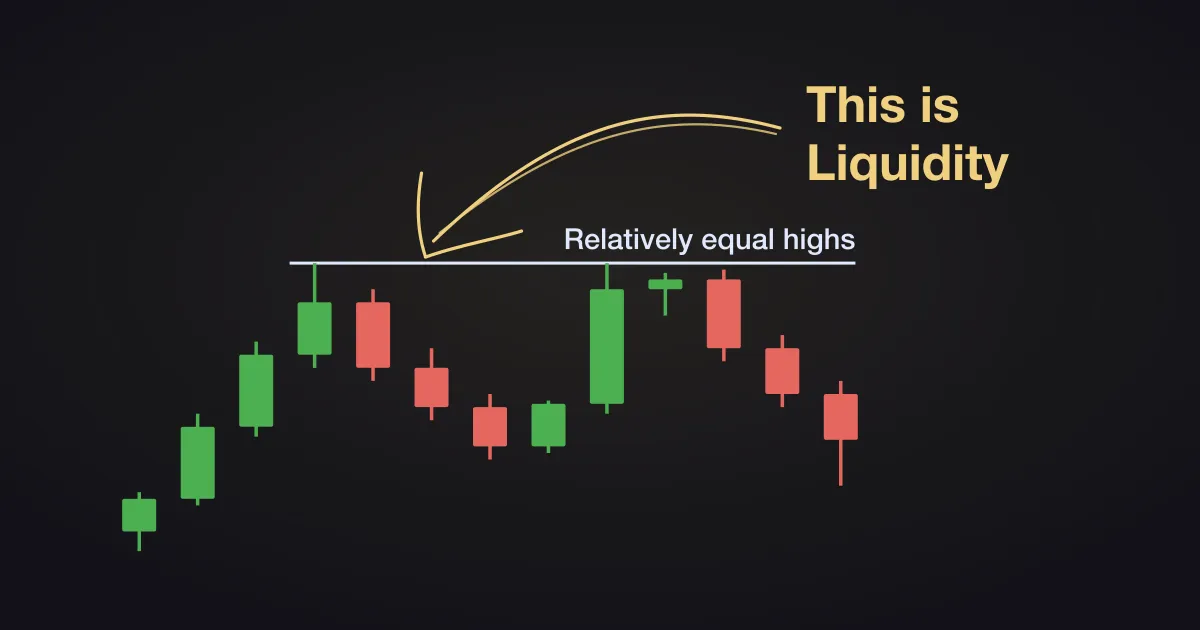
In ICT trading, liquidity means the resting orders a move can pair against: the buy stops sitting above old highs and the sell stops sitting below old lows. The claim underneath the whole framework is that those levels are not support and resistance. They are where price is going, which is why ICT refers to them as “draws on liquidity”.
That one idea reorganises how you read a chart. A double top stops being a ceiling and becomes a target. A tidy row of equal lows stops being a floor and becomes the reason price is about to visit it. Once you read levels that way, you need the vocabulary that goes with it. Buyside and sellside liquidity. These are the pools of buy stops and sell stops.
Internal and external range liquidity, which decide where you enter and where you exit. Relatively equal highs and lows, the pools that get drawn to on charts. The liquidity sweep, also called a stop hunt, a liquidity grab or a raid. And the low and high resistance liquidity runs, which tell you whether today is worth trading at all.
This guide explains all these concepts, and the question that traders wonder: which lows and highs actually get run, and when.
What liquidity means in ICT trading
ICT quotes the textbook definition himself: the degree to which a market can be quickly bought or sold without affecting the asset’s price.
That is not what the word means on a chart.
On a chart, liquidity is the orders waiting to be filled at a price. The largest and most predictable clusters of those orders are stops. Traders who are long put their stops below a recent low. Traders who are short put theirs above a recent high. A stop below a low is a sell order; a stop above a high is a buy order. So every obvious swing high has buy orders stacked above it, and every obvious swing low has sell orders stacked below it.
The term comes from ICT (aka Michael J. Huddleston, or the Inner Circle Trader), whose teaching is where most of this vocabulary originates. He calls the buy stops above an old high buyside liquidity and the sell stops below an old low sellside liquidity. You will see them shortened to BSL and SSL.
The stops matter because a large position needs the other side of the trade. To buy in size you need sellers, and the most reliable place to find a burst of selling is just below a low where sell stops will trigger. To sell in size you need buyers, and they appear just above a high. The narrative ICT attaches is that the market is engineered to seek those clusters, and that a level which has been built up deliberately to be taken is engineered liquidity.
You do not have to believe the narrative to use the read. The observable part is that price has a habit of trading to those levels, and the useful part is that the framework gives liquidity two jobs.
The first job is bias: where price is more likely to go next. The second is framing a trade: where the entry is and where the target is. This guide touches upon both.
Internal and external range liquidity
Take any trading range on your chart, the span between a swing high and a swing low. Liquidity sits in two places relative to it.
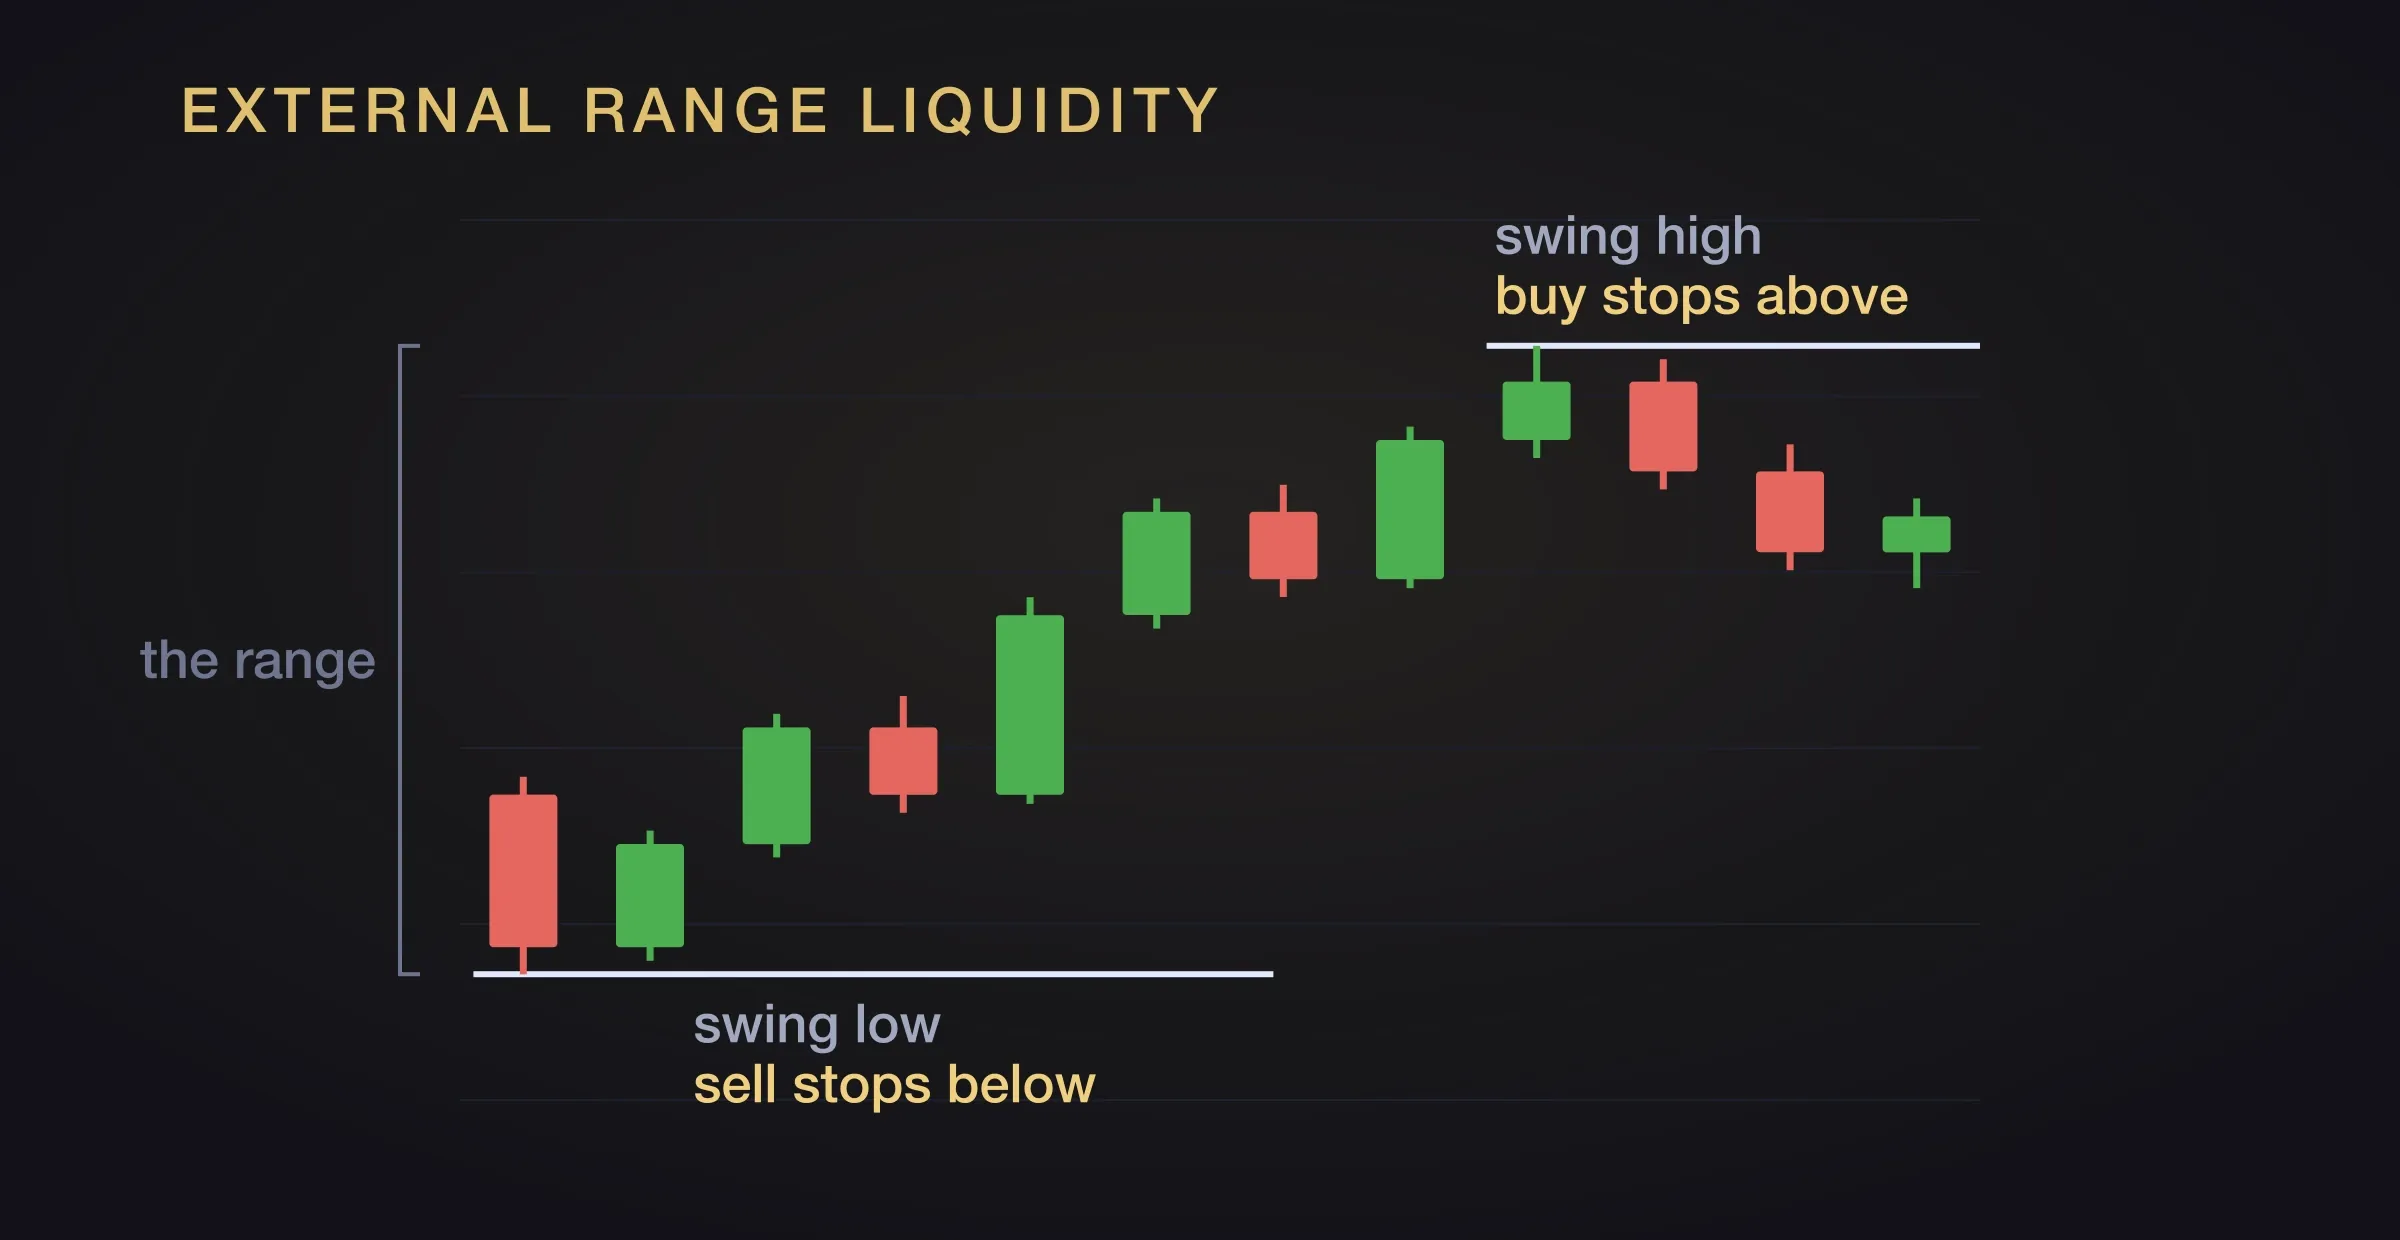
External range liquidity is above the high and below the low of the range. It is the most protected liquidity on the chart, because the stops resting there belong to the biggest positions and the highest timeframes. These are the levels price is drawn to. They get traded to, cleared, taken out, and when they go it tends to be decisive.
The current range is the core case, but not the only one. The target is often the long term high or low, and that can be the extreme of a previous range, several ranges back, or a range on a higher timeframe. The high of the range in front of you might be an intermediate term high with a long term high further up. Both are external range liquidity. Which one price is reaching for is a bias question, and it is the reason ICT traders start on the higher timeframe.
Internal range liquidity is everything inside the range that price can be drawn to first. It is one idea at two scales.
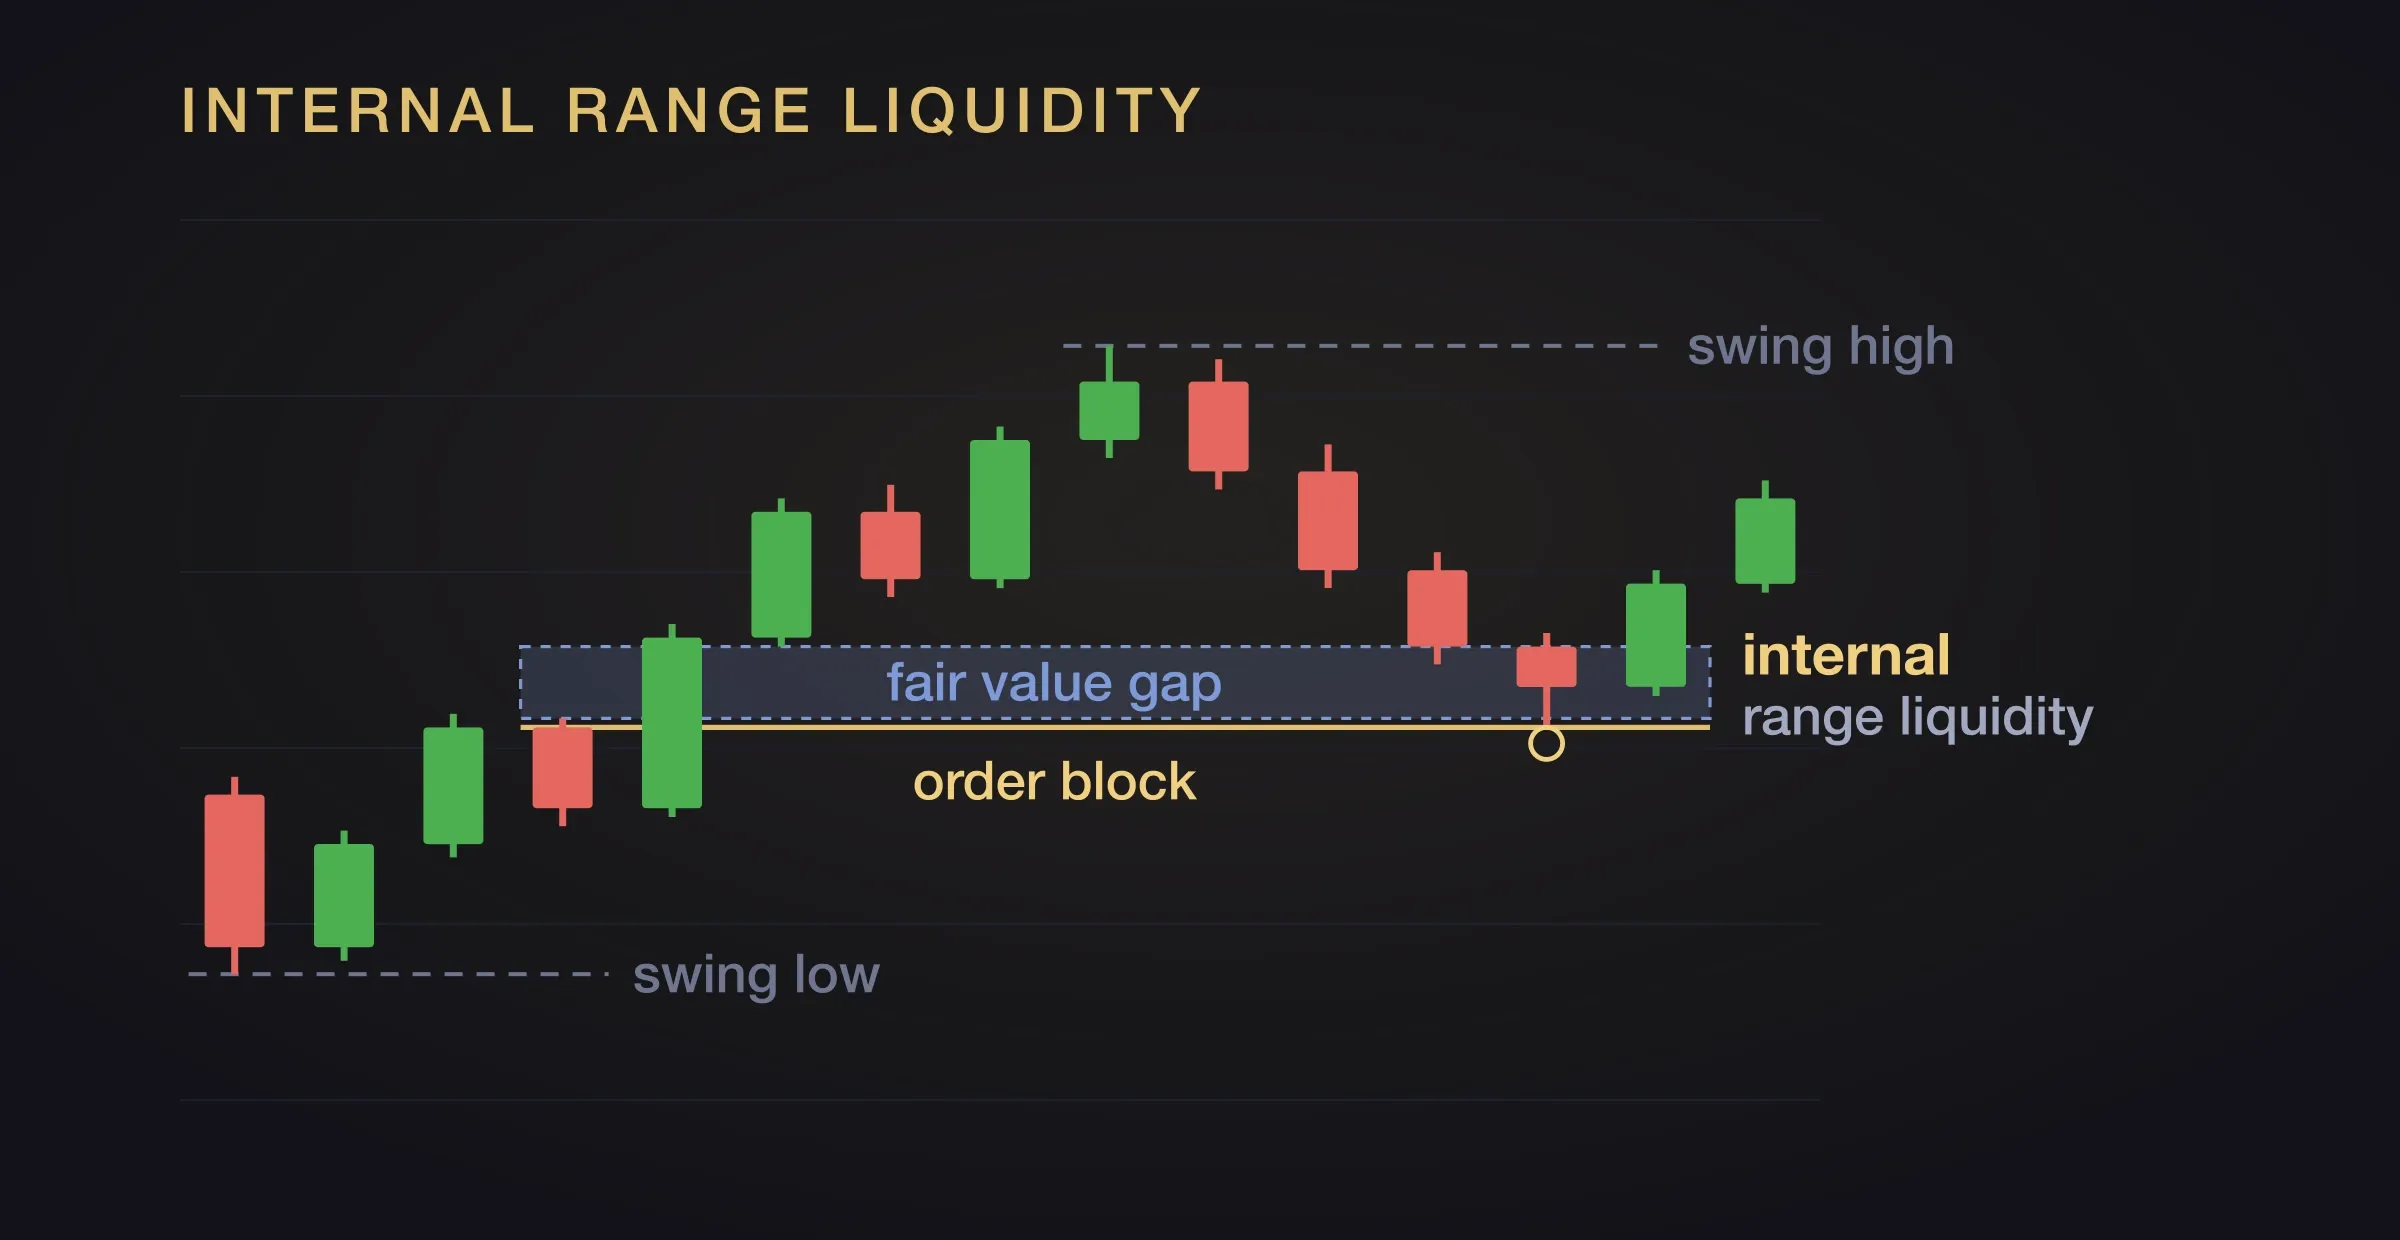
At the first scale it is the PD arrays inside the range: the fair value gaps, volume imbalances and order blocks that price left behind on the way, which are seen as imbalances that price has a tendency to return to.
At the second scale it is the minor swing highs and lows inside a larger, higher timeframe range. A local low forms, price rises, then comes back and either takes out or sweeps that low at or near one of those PD arrays. When it reverses, that is known as a sweep of a smaller range inside of the larger one, and it is also internal range liquidity.
ICT has said that he predominantly buys or sells at internal range liquidity and exits at external range liquidity. That one line is the whole framework’s trade structure. The entry is inside the range. The target is outside it. Price tends to travel from one to the other.
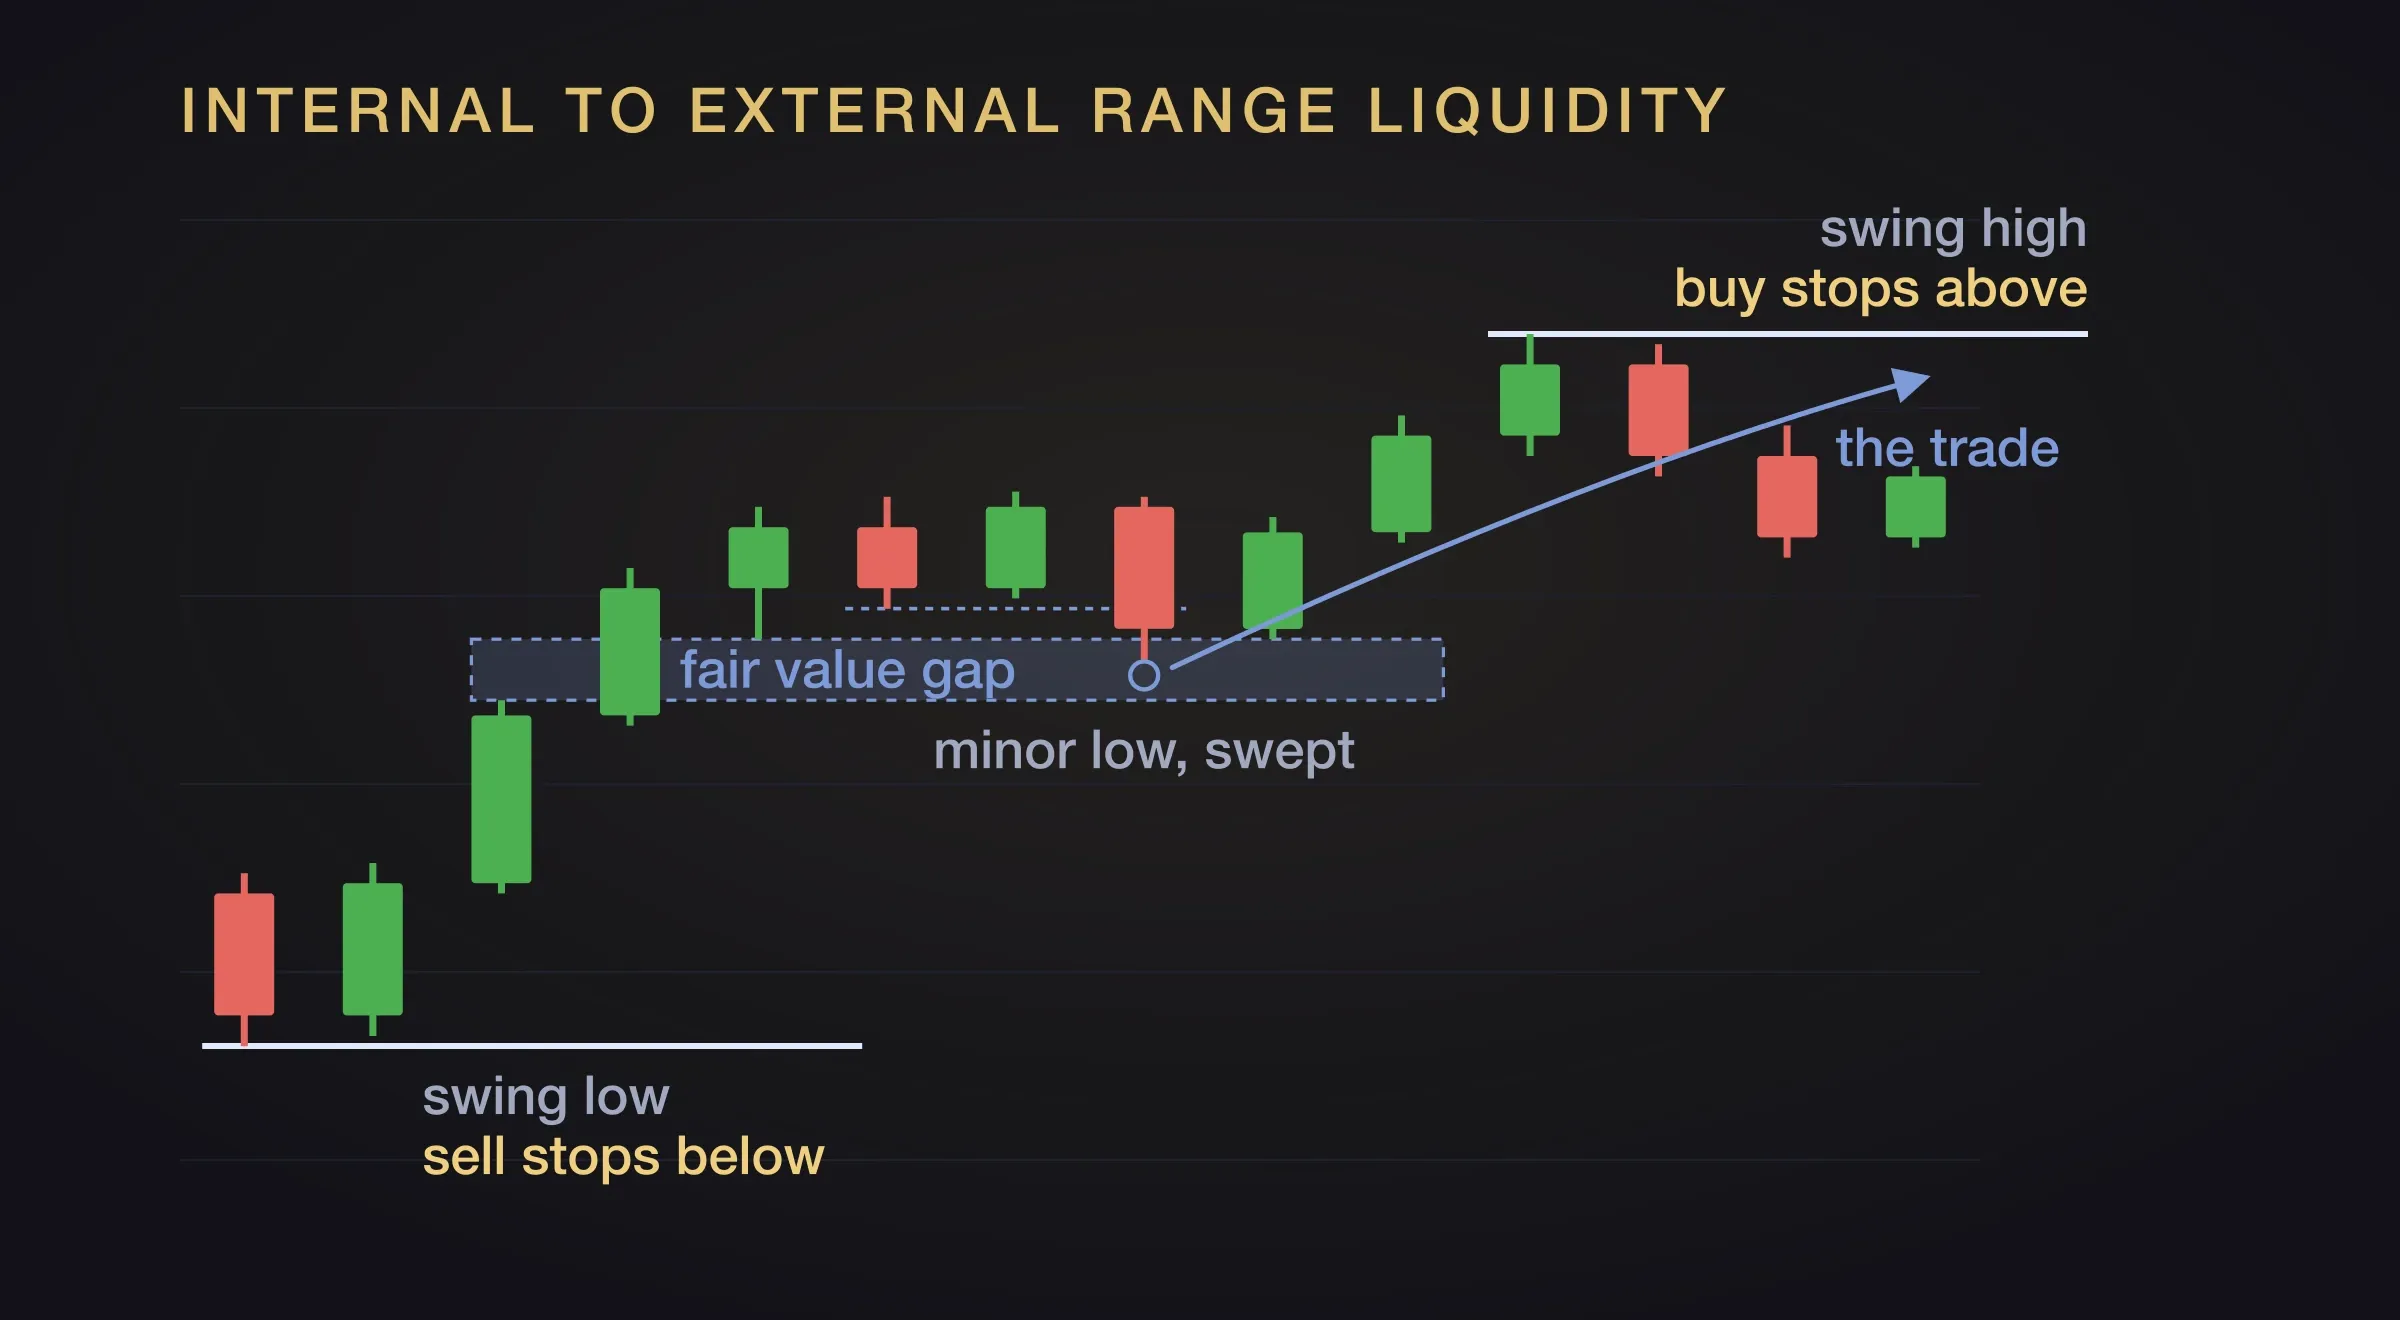
In practice the frame looks like this, for a market making higher highs and higher lows:
- Establish the trend from the swings (from the high to the low of a range).
- Take the most recent range in the trend’s direction and split it into a premium and discount half.
- Look for the entry in the discount half, at internal range liquidity: an optimal trade entry, a fair value gap, an order block, or a sweep of two or three short term lows.
- Target external range liquidity, the high that breaks the range.
Everything mirrors for a downtrend. And the targets scale with the timeframe you trade: on a five minute chart you are targeting the local highs, on a four hour chart the ones that took weeks to form.
Where liquidity rests: equal highs, equal lows, and trendlines
Stops cluster wherever a lot of traders agree a level matters, and the places they agree on are visible.
Relatively equal highs, and their mirror, relatively equal lows, are the clearest. Two or more highs land close enough together that a single horizontal line, drawn at the uppermost point of the candle, the top of the wick, reads as the level for both. For lows, the line goes at the bottom of the tail. Everyone who shorted either high has a stop just above that line. Everyone who bought the double bottom has a stop just below it.
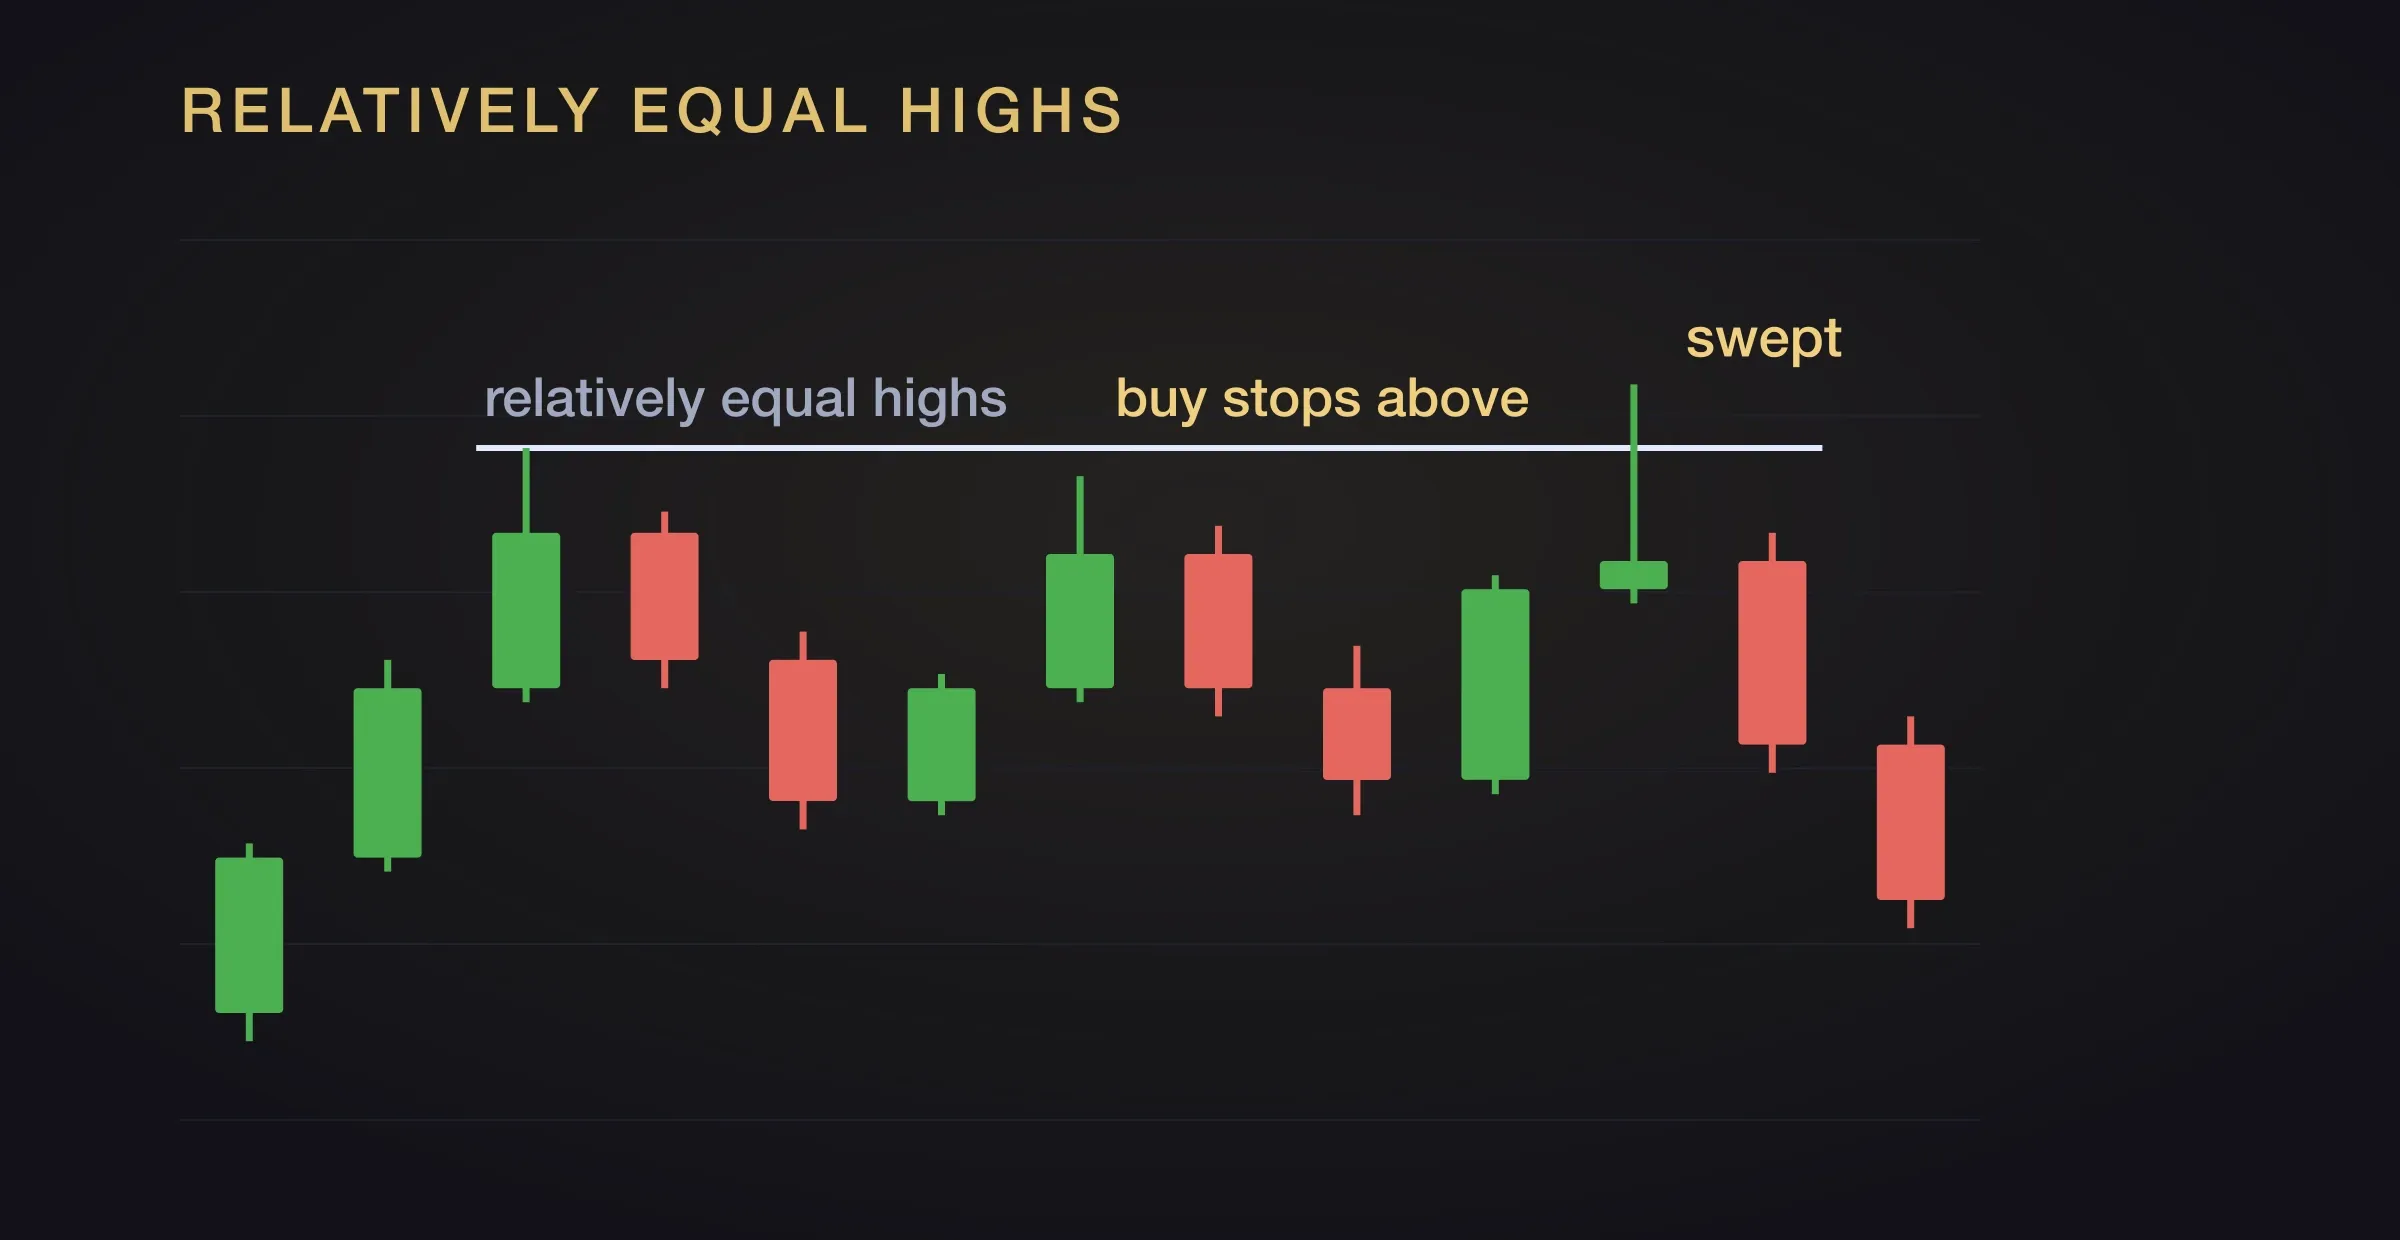
Usually it is two touches. It can be three or more, and every extra touch makes the level more obvious, more crowded, and more likely to be run.
ICT’s phrasing is that double tops and double bottoms are not resistance and support, they are where liquidity lies. Two or three equal highs will very likely be poked through before price either keeps trending or moves the other way.
Smooth edges tend to become jagged.
ICT (Michael J. Huddleston)
Where the classical read says the level should hold, the liquidity read says price will run it, and gives you a way to estimate how far. Take the swing between the two tops, project it beyond them, and that is a first estimate of the run. ICT teaches that this works better on higher timeframes, such as the hourly and above.
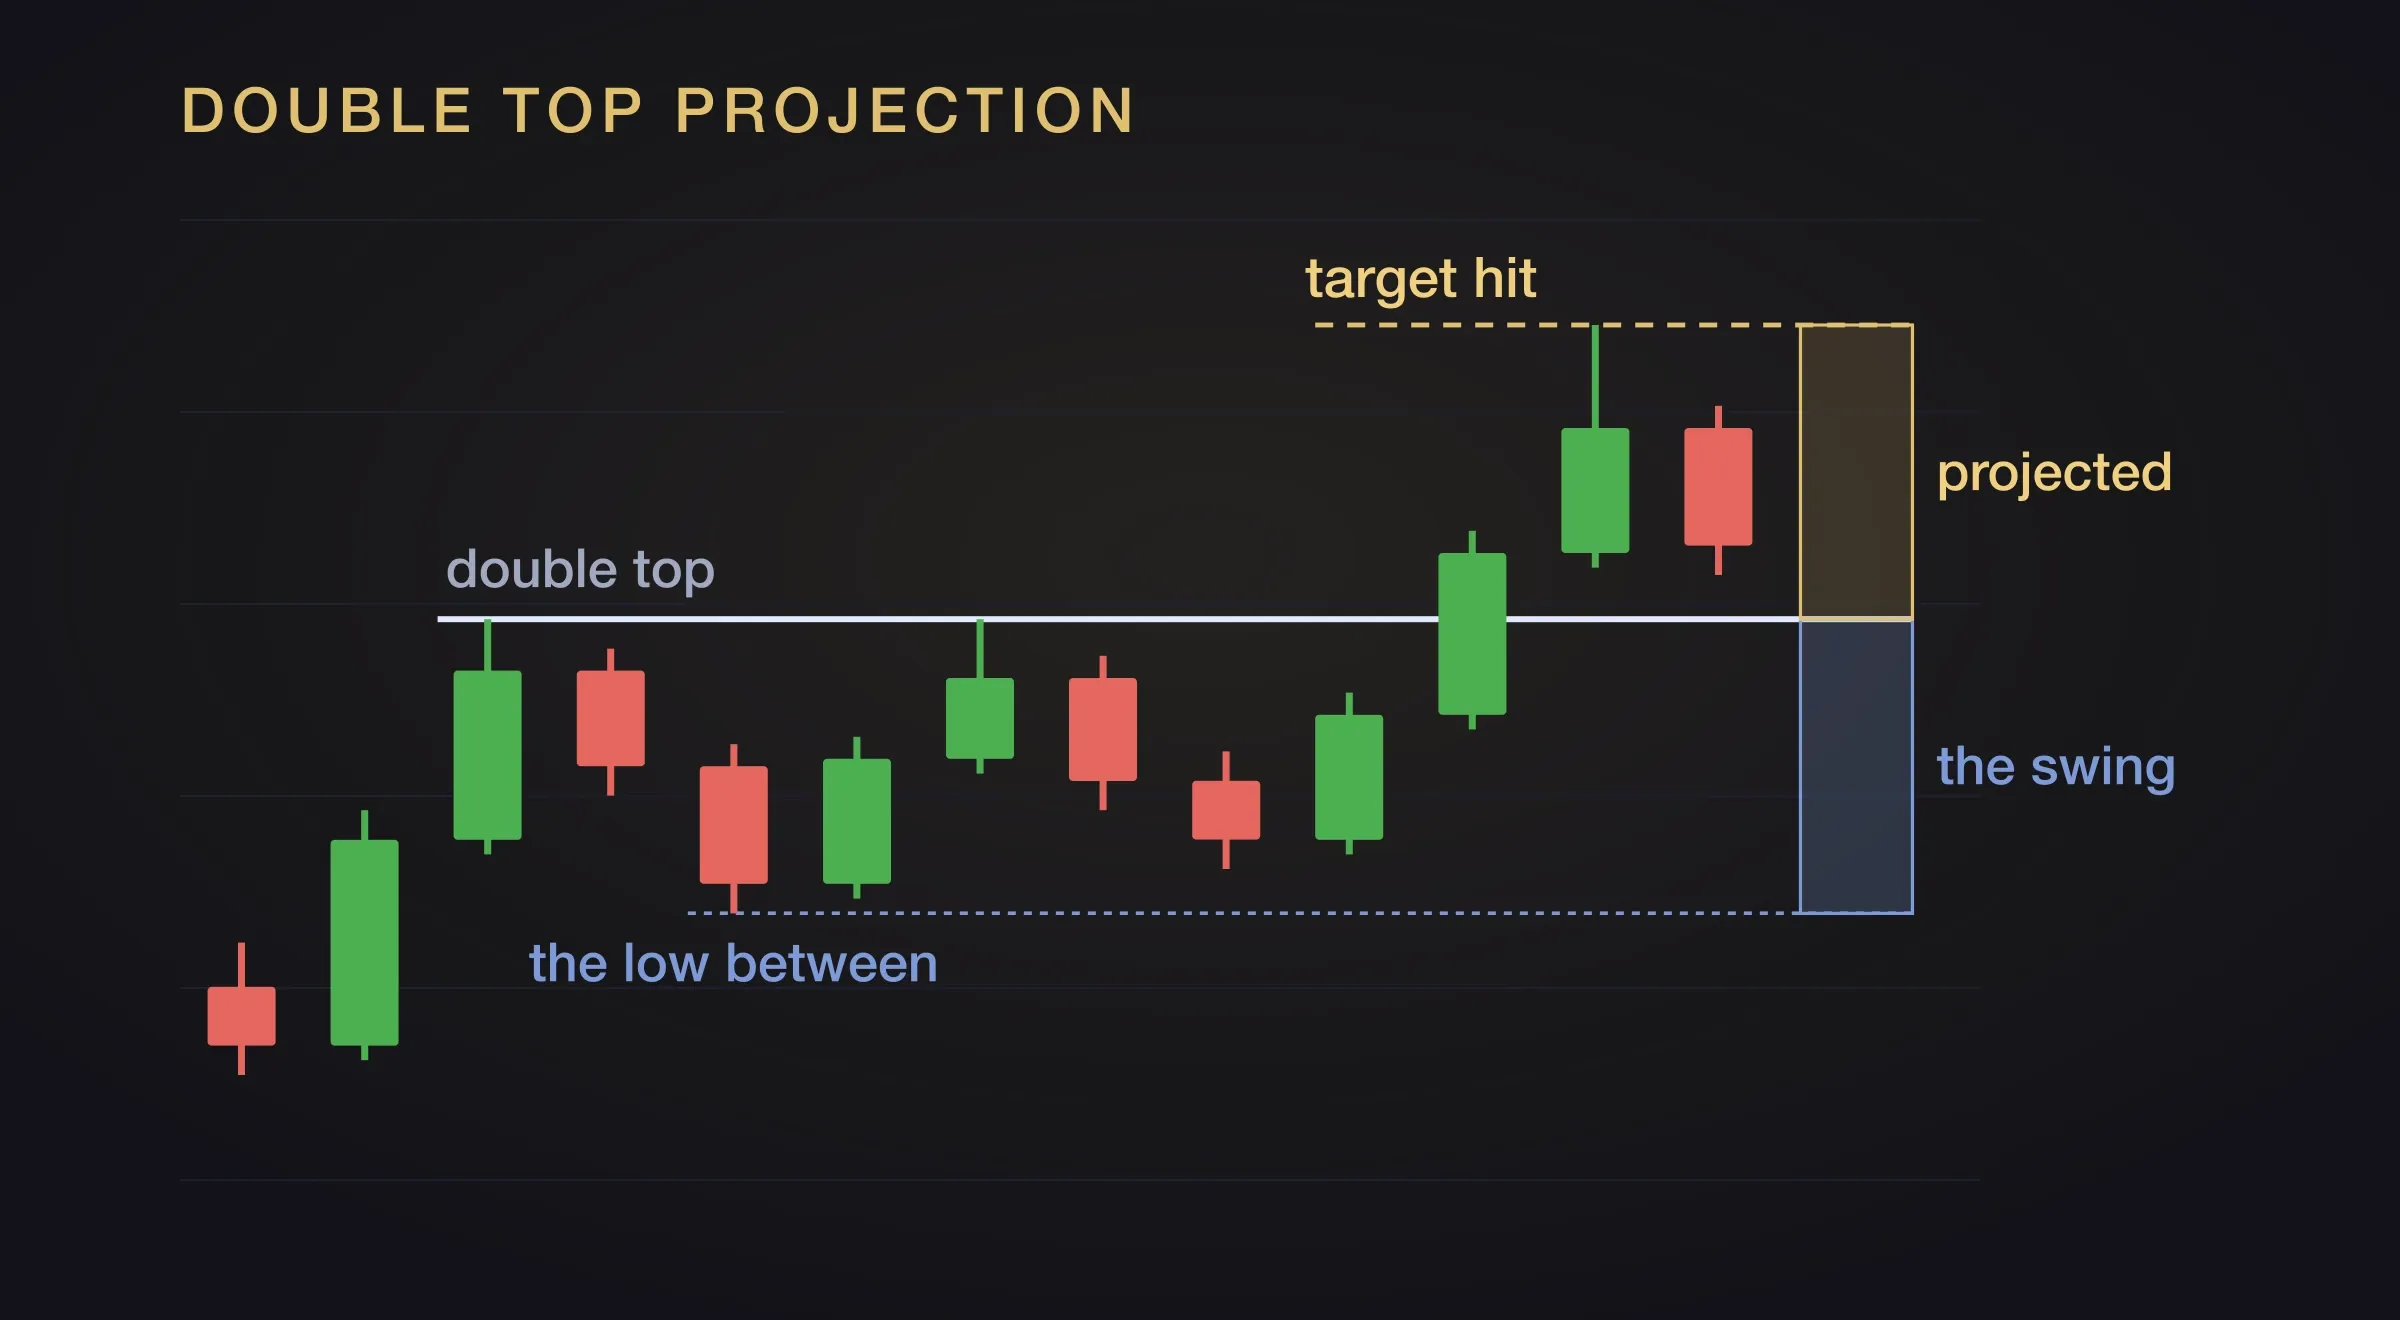
How equal is relatively equal? ICT never put a number on it, and this guide will not either, because it isn’t important. It is an eyeball call. Zoom out, draw the line, and ask whether it makes sense as a single level. One heuristic, offered as a heuristic and not a rule: the two candles that made the highs should overlap in price. If they do not overlap at all, the highs are probably too far apart to share a pool. A very small candle can break that test, so treat it as a sanity check and nothing more.
Trendlines are the other place. A rising series of higher lows primes traders to draw a diagonal support line and buy every touch, with a stop just under it. That line has nothing to do with the market; it is where a lot of similar people put a lot of similar orders, which makes it a pool. The same goes for the diagonal drawn under a bear flag or above a falling channel.
One thing to hold onto: these levels are targets, not necessarily today’s targets. A pair of equal highs might sit untouched for days. Price needs a reason to go there, and the reason is usually time of day or economic news. The liquidity pool tells you where; it does not tell you when.
What is a liquidity sweep?
A liquidity sweep is price trading through a level where stops rest, and then coming back. The same event gets called a stop hunt, a liquidity grab or a stop raid, and the words are interchangeable. It can also be known as a turtle soup. Sweep is the most common.
Mechanically it is two steps.
Step one: price trades through the level. A wick through is enough. This matters more than it sounds, because a sweep looks completely different depending on the timeframe you are watching. On the timeframe the level was drawn on, the whole event is often one candle with a long wick. Drop to a lower timeframe and the same event is ten or fifteen candles trading above the level, closing above it, before price finally returns. Neither view is wrong, and the lower timeframe closes do not disqualify the sweep. Check the timeframe the level came from.
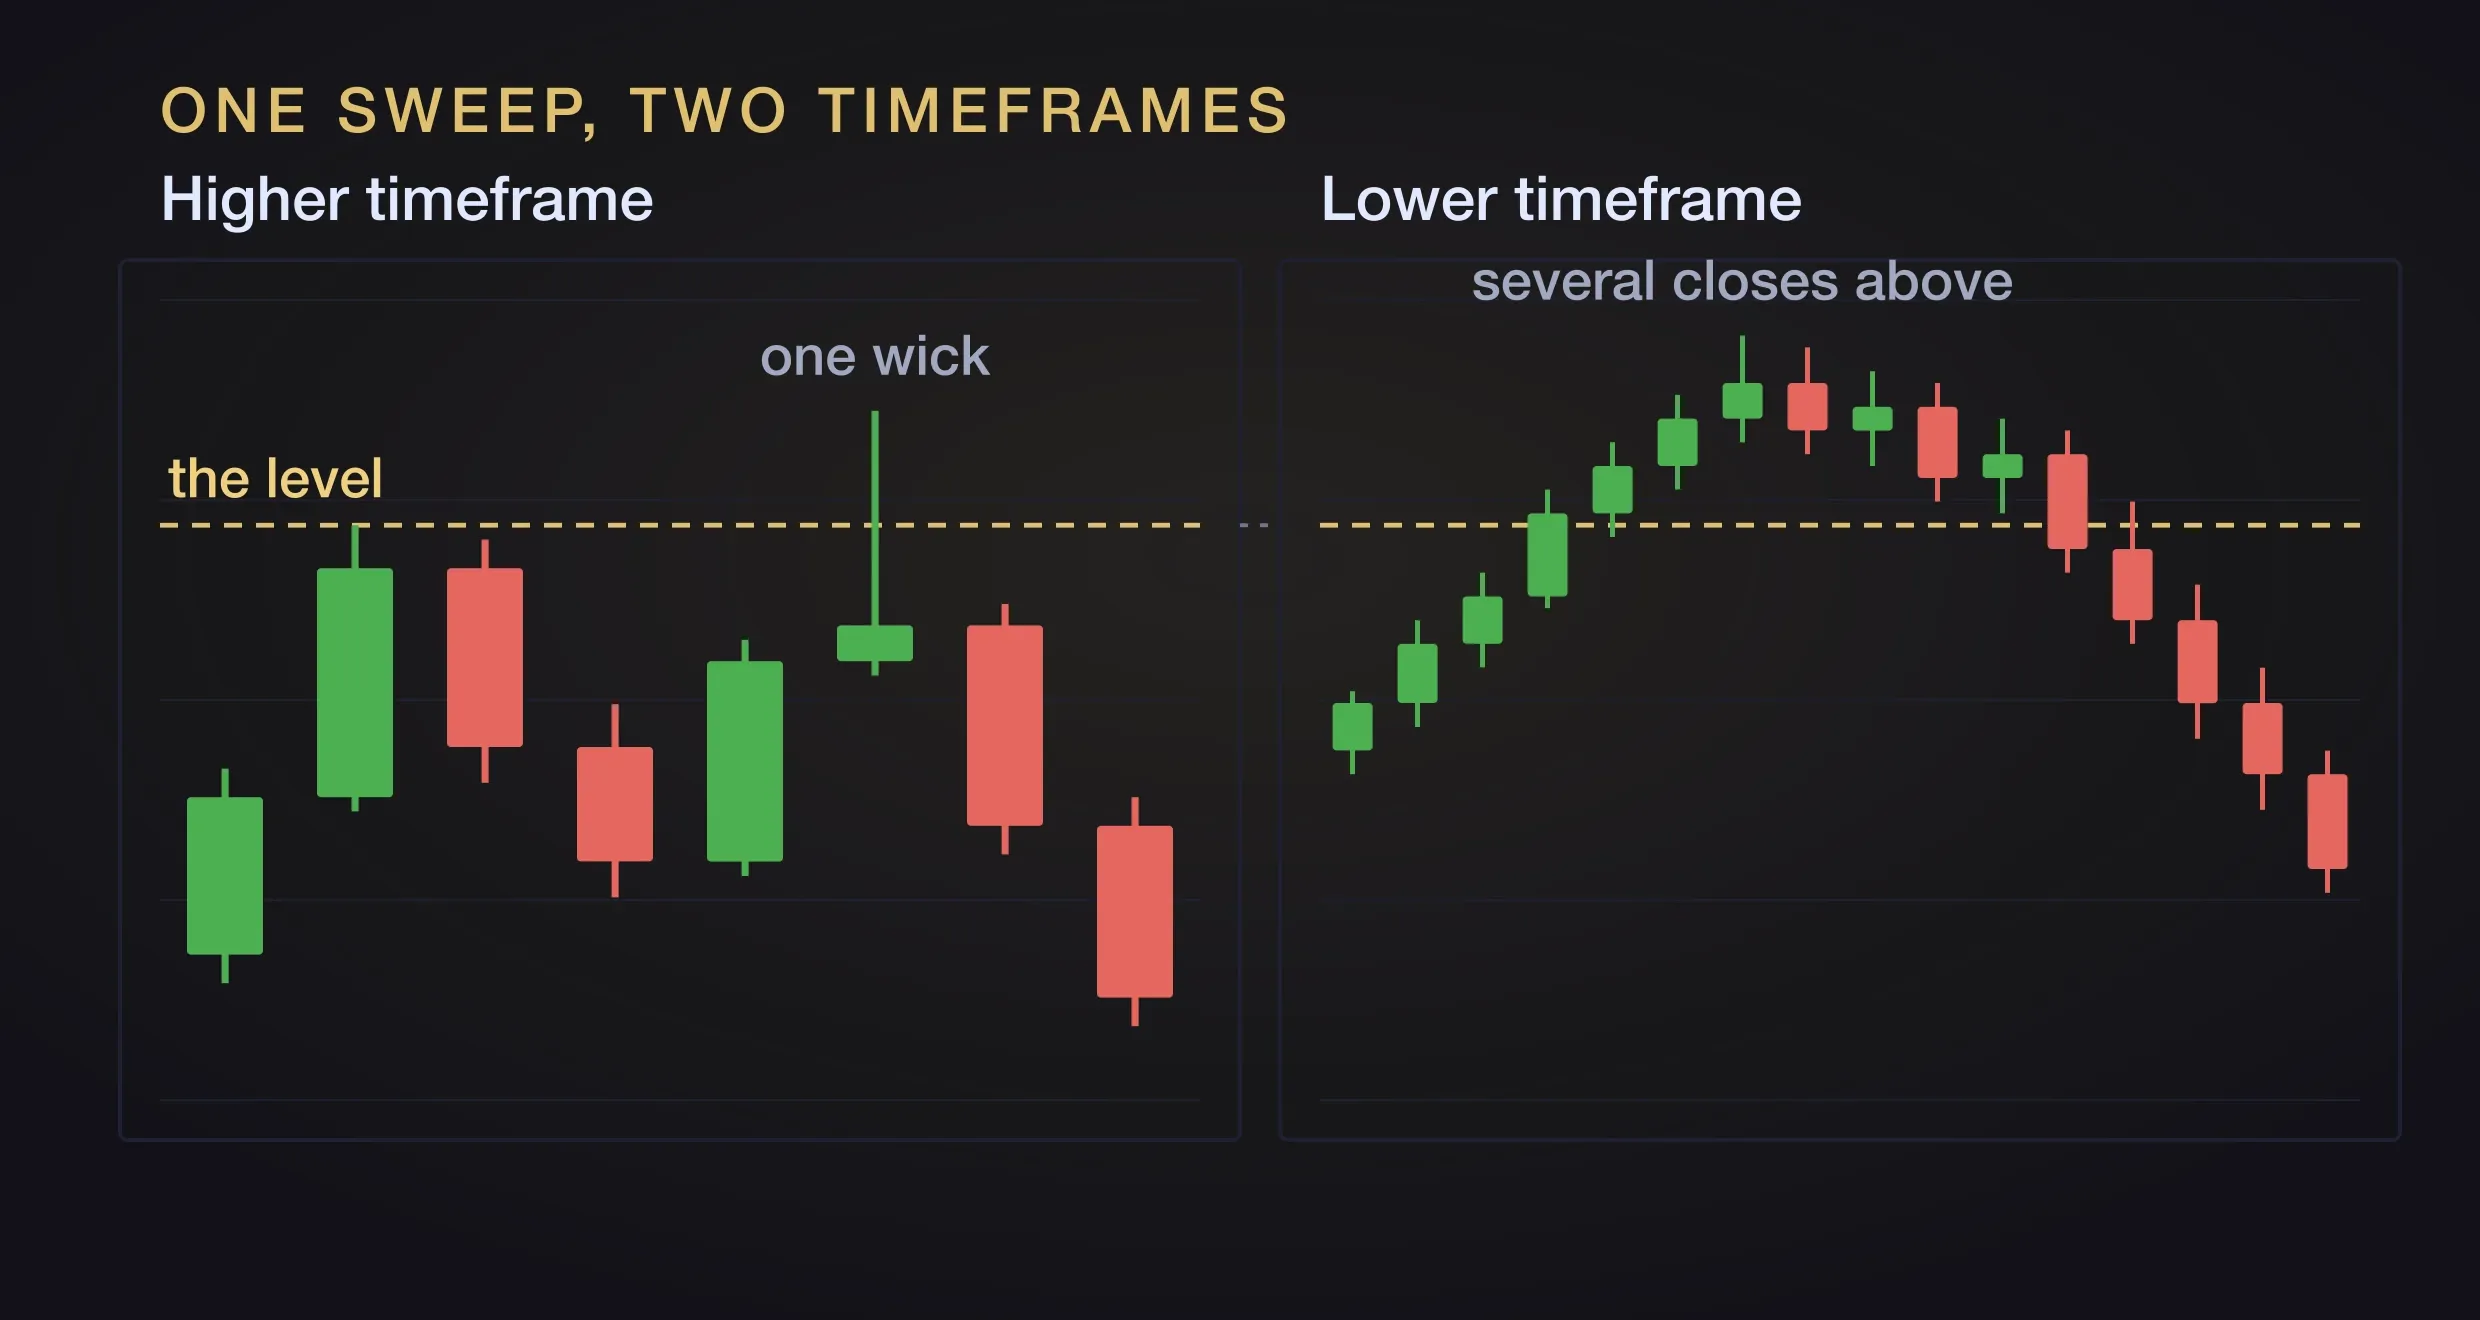
There are two depths to a sweep. A full sweep takes the absolute high, wick included. A body sweep passes the top of the candle bodies at the level and trades into the wick, without taking the absolute high. The body sweep is ICT’s own definition, from his rejection block lesson: price reaches up above the body of the candles to run buyside liquidity out before it declines. The rejection block is the PD array built on exactly that behaviour. The same distinction, between taking the high and only taking the bodies, is also part of what separates a breaker block from a mitigation block.
Step two: price comes back. The higher probability version of a sweep closes back inside the range: the candle wicks through the level and closes below the high it just took. A candle that closes above the level and stays there is weaker, not dead. It may be consolidating, or reaching for a PD array further up before it turns, and only the higher timeframe will show you which.
That raises the obvious question. When does a run through a level stop being a sweep and become a breakout?
There is a point where it does. A strong, clear close through the level, with displacement behind it, is more likely to keep going than to come back. But where that point sits has not been measured, by ICT or by anyone else publishing, and there could be another element that makes an eyeball read unreliable. Having a higher timeframe PD array just above the level can pull a genuine sweep further than you expect before it returns, so it looks like a failed breakout first and a sweep only in hindsight.
So treat the sweep as what it is. A liquidity sweep is the potential for a reversal or a pullback, not the reversal itself. After a sweep price can turn, or it can consolidate for a while and continue in the original direction. The sweep tells you a question has been asked of the level. It does not tell you the answer.
A turtle soup, for the record, is a sweep dressed as a failed retail pattern: a bull flag that breaks up just far enough to fill the breakout orders and then goes the other way. Same mechanism, different name for the bait.
What happens after a liquidity sweep
A sweep on its own is a single candle. What ICT traders actually wait for is a sequence, and how much of it you insist on is the trade-off between confirmation and entry price.
In rough order, for a sweep of a high:
- The candle closes back inside the range, below the high of the wick of the previous candle.
- The high that was taken traded into a higher timeframe PD array like a fair value gap. Check that it did, as price should not reverse from nowhere.
- Price closes back below the first order block that entered into the PD array.
- Price returns to that order block, but does not trade back through it.
- Often an inverse fair value gap or a fresh fair value gap forms here, and becomes the next reference level.
- A short-term low inside the range breaks with a strong close down.
- Price retraces into the order block or fair value gap created (likely also coming back into the breaker or mitigation block) and continues lower.
Two steps in is an early entry with minimal confirmation signs and more failures. Six steps in is a late entry with a tight stop and a lot of missed moves. There is no right answer, and the point of writing the sequence down is that it becomes a testable one. Whether waiting for step four is worth what it costs you in entry price is something backtesting can tell you and an opinion cannot.
Low and high resistance liquidity runs
This is the part of the liquidity vocabulary that answers a different question: not where price is going, but whether the conditions are worth trading at all.
Two terms, and they are easy to run together. Low resistance describes conditions. A low resistance run is the move that happens in them.
Start with the opposite. A high resistance liquidity run is the slow, choppy, lethargic kind of move. Price is trending, but it does not want to go. It grinds down, bounces, grinds down, bounces, because at every step there are stops to clear and orders to work through. ICT describes the low probability version of a market as one with many intermediate highs and lows before the eventual high or low. Each of those is resistance, and price has to get through all of them.
Now look at what that grind leaves behind. Every bounce in a choppy decline puts in a lower high, and most of those highs are wicks. Draw a line along them and it slopes down. Above each one sits a cluster of buy stops from the traders who shorted the bounce. Nothing is defended between those levels; they are just a stack of fuel.
That stack is low resistance conditions. And when price finally bottoms, the move up runs the entire stack in one fast, sudden expansion, straight through every wick high to the external range liquidity above. That move is the low resistance liquidity run. It meets little liquidity on the way because everything on the way has become the thing driving it.
The grind down is the signal and the run up is the actual trade. Everything mirrors for the other direction: a slow, choppy rally builds a sloping stack of sell stops, and the eventual break down runs them all at once.
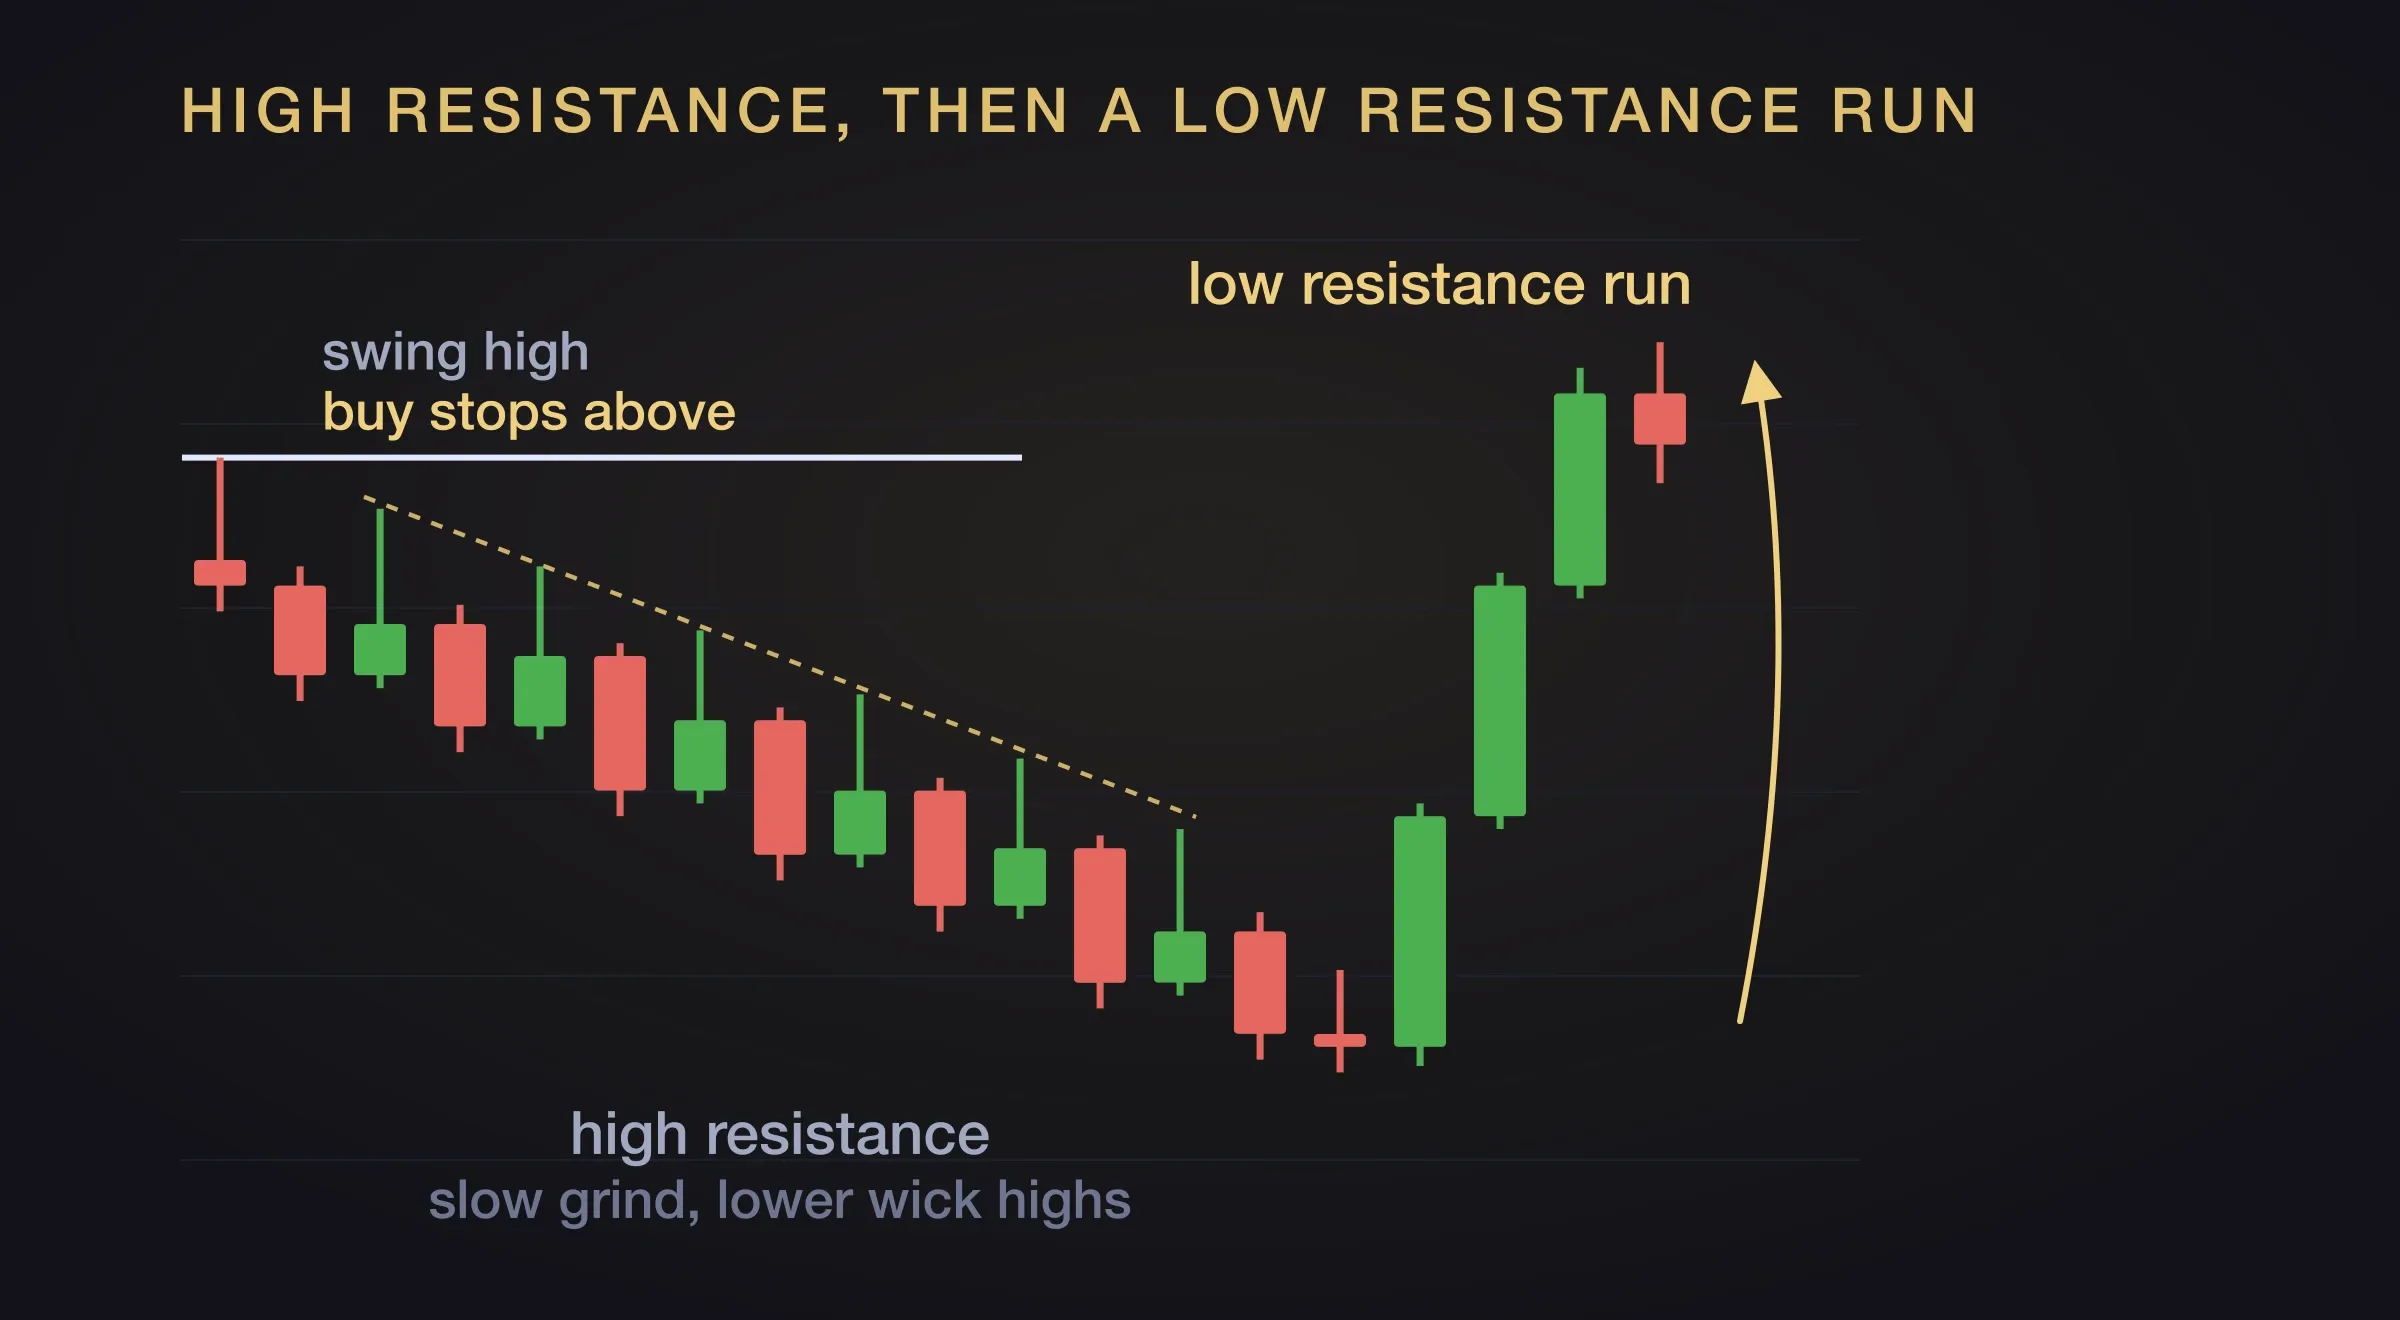
Telling which conditions you are in is a real-time problem, and ICT’s tape reading gives a filter for it that works in real time rather than in hindsight.
That is worth more than most entry rules, because it is a rule for staying out. The failure mode to avoid is labelling the condition after the move. Choppy in hindsight is not a filter. Using the fair value gap test is.
Not every low gets swept
The most common mistake with all of this is assuming every level gets run.
Stocks and indices have an upward bias. Over time they keep making new highs, so the highs mostly do get taken eventually. It is the lows that get left behind. A pair of relatively equal lows can sit on a chart for months with price never coming back for them, and a trader who has just learned about liquidity will spend those months waiting for price to take out those lows and that sweep never happens.
Whether a level is run depends on things the level itself cannot tell you.
Higher timeframe bias governs lower timeframe structure. Lower timeframe liquidity does not take precedence over higher timeframe liquidity. Price can sweep only the internal range level and turn. It can fall just short of the external one and turn, because a bigger level somewhere else is the real draw. Some levels are simply stronger than others, and the one you have been staring at is not always the one the market is reaching for.
Some sweeps are expected rather than possible. In ICT’s market maker buy model, there is one sweep in the first stage of accumulation, before price is sent off, and the mirror of it in the market maker sell model. At the New York open, the judas swing is the sweep that starts the session, a sharp move into a pool and an immediate reversal. After lunch, the morning’s liquidity hunt is done, and a sweep of the most recent highs or lows formed tends to come before the afternoon resolves into continuation, reversal or sideways chop.
Outside those places, the plain statement is this. No one can say for certain that a given level will be swept or left alone. You build a bias from the concepts, stack whatever confluences you have, size your risk, and either it works out or it does not. Liquidity is one part of a bigger picture. It is not the entire picture.
Do liquidity sweeps actually work?
Nothing above answers that for the market you trade. Only backtesting does, and seeing these concepts in action on the charts.
Write these down before you mark anything:
- How equal is relatively equal? Pick a tolerance and write it down.
- On which timeframe are liquidity sweeps most reliable, and how do the candles close?
- How far past the level, or how many candles held above it, before you call it a breakout instead of a sweep?
- What is the horizon? How many candles or sessions before you call a level “never returned to”?
Then the study has two stages.
The simple one. Pick one instrument and one timeframe. Mark every pair of relatively equal highs and lows, including the ugly ones. For each, record whether price came back, how long it took, and whether it swept the level or broke through it. How often does it never come back at all?
The annotated one. For every level that was hit, record what was present when it happened. Time of day. A news event. A higher timeframe PD array at or just beyond the level. An internal range sweep on the way there. Which array was at the level, and on which timeframe. Whether price arrived at an optimal trade entry or merely in discount. Then look for the context that has an edge, because “equal highs get swept” is not the finding. “Equal highs get swept when a four hour fair value gap sits above them” would be.
How many backtest samples do you need before the result means anything? BacktestingLab has a free tool for working out the sample size based on an expected range. It is built for trades, but it also applies to occurrences of a concept just as well.
Doing this entirely by hand is a long and boring process. The first stage alone means marking hundreds of levels and logging each outcome with your tolerance held perfectly steady across the whole sample. The second stage multiplies that by a dozen annotations per hit. It is slow, repetitive work, and then the work keeps growing if you want to do it for multiple timeframes.
In a tech savvy world, this is not the best way to backtest and it is one of the reasons BacktestingLab is being built. Its creator, David Nowak, came to trading from a programming background, and believes code should help you get consistent answers much faster and more reliably than fully on your own with a mouse.
One eventual aim for BacktestingLab is to help you to mark out such points of interest (e.g. every relatively equal high and low) in your data, and allow you to get the answers to your questions around what price does at these levels much faster. As the software’s job is to put the right chart locations in front of you a few hundred times faster than you could find it manually.
Until BacktestingLab is released, the work is still worth doing on a smaller scale. A concept becomes clearer when you see it repeatedly happening with your own eyes in the charts.
Where this fits
Liquidity is one concept inside one approach to trading, and it is the one the rest of ICT’s vocabulary leans on. Learning to read it is worth doing. It is still only the first stage of turning a concept into something you can rely on.
If you want the wider path, the five stages from learning an approach through to trading it live are laid out in how to become a profitable trader.