What Is an Order Block? ICT Order Blocks Explained
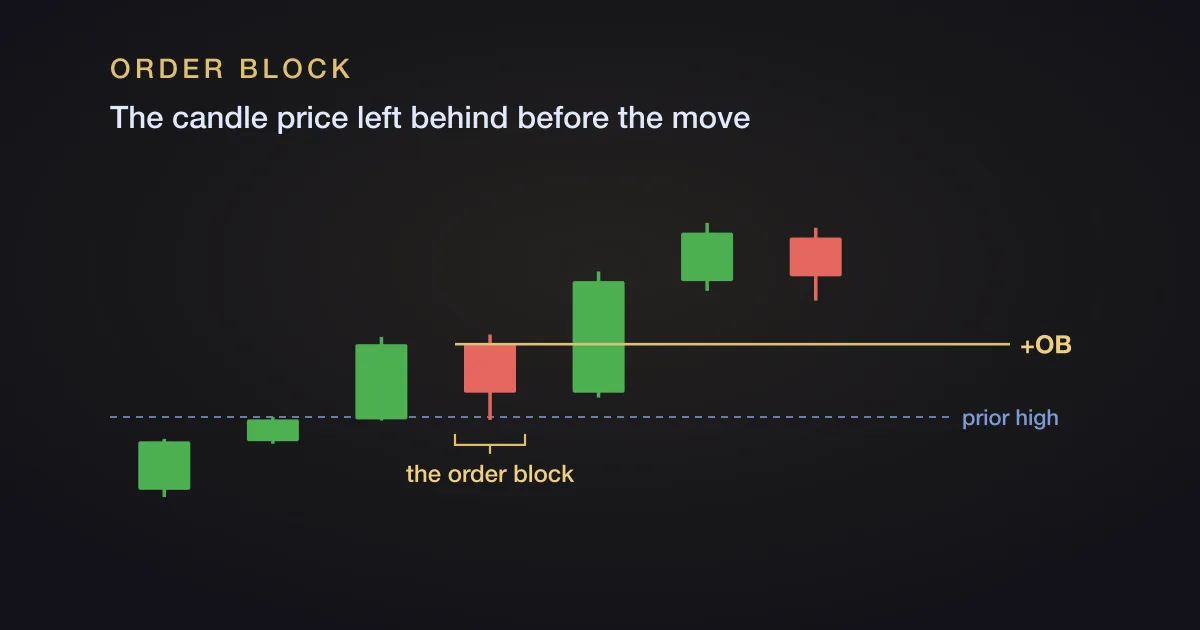
An order block is the candle, or run of candles, that ran against the direction price is moving and entered into a previous support level. In a rally, it is a down close (red) candle. In a selloff, it is an up close (green) candle.
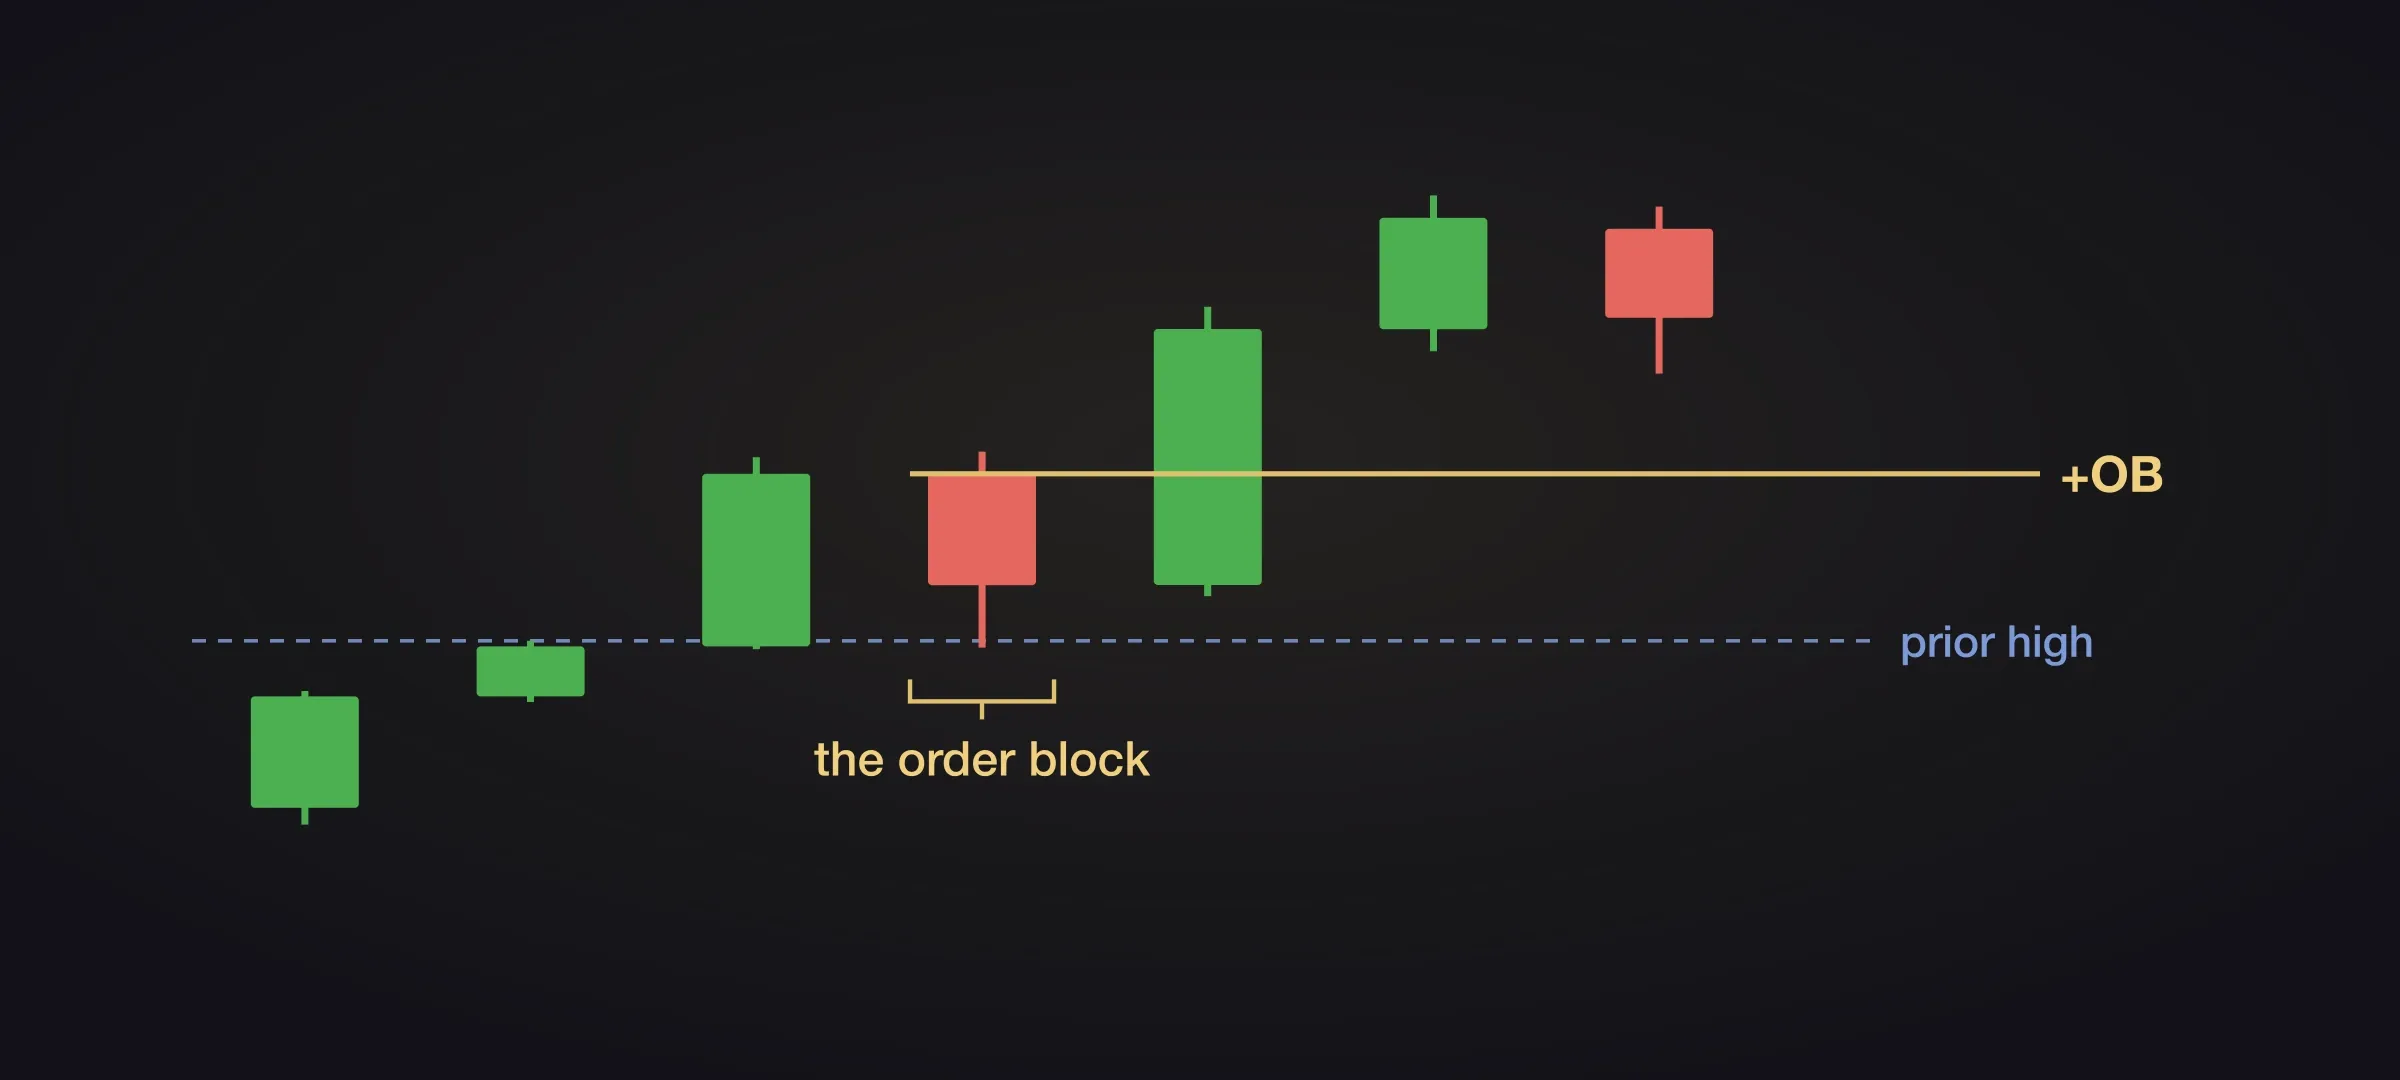
Traders mark them because price has a habit of coming back to them, but not all down or up close candles are significant. Within ICT’s Premium Discount (PD) array matrix, an order block is stronger than most PD arrays and thus carries more weight.
The concept only takes several minutes to learn, but knowing which order blocks are important requires deeper knowledge. And you’ll notice a couple subtle ambiguities even when you are learning from the man himself.
A closer look at what an order block actually is
Some explanations of this concept will tell you to find the last candle that went the opposite way, and call that the order block. However, that is not the proper definition as it was originally taught.
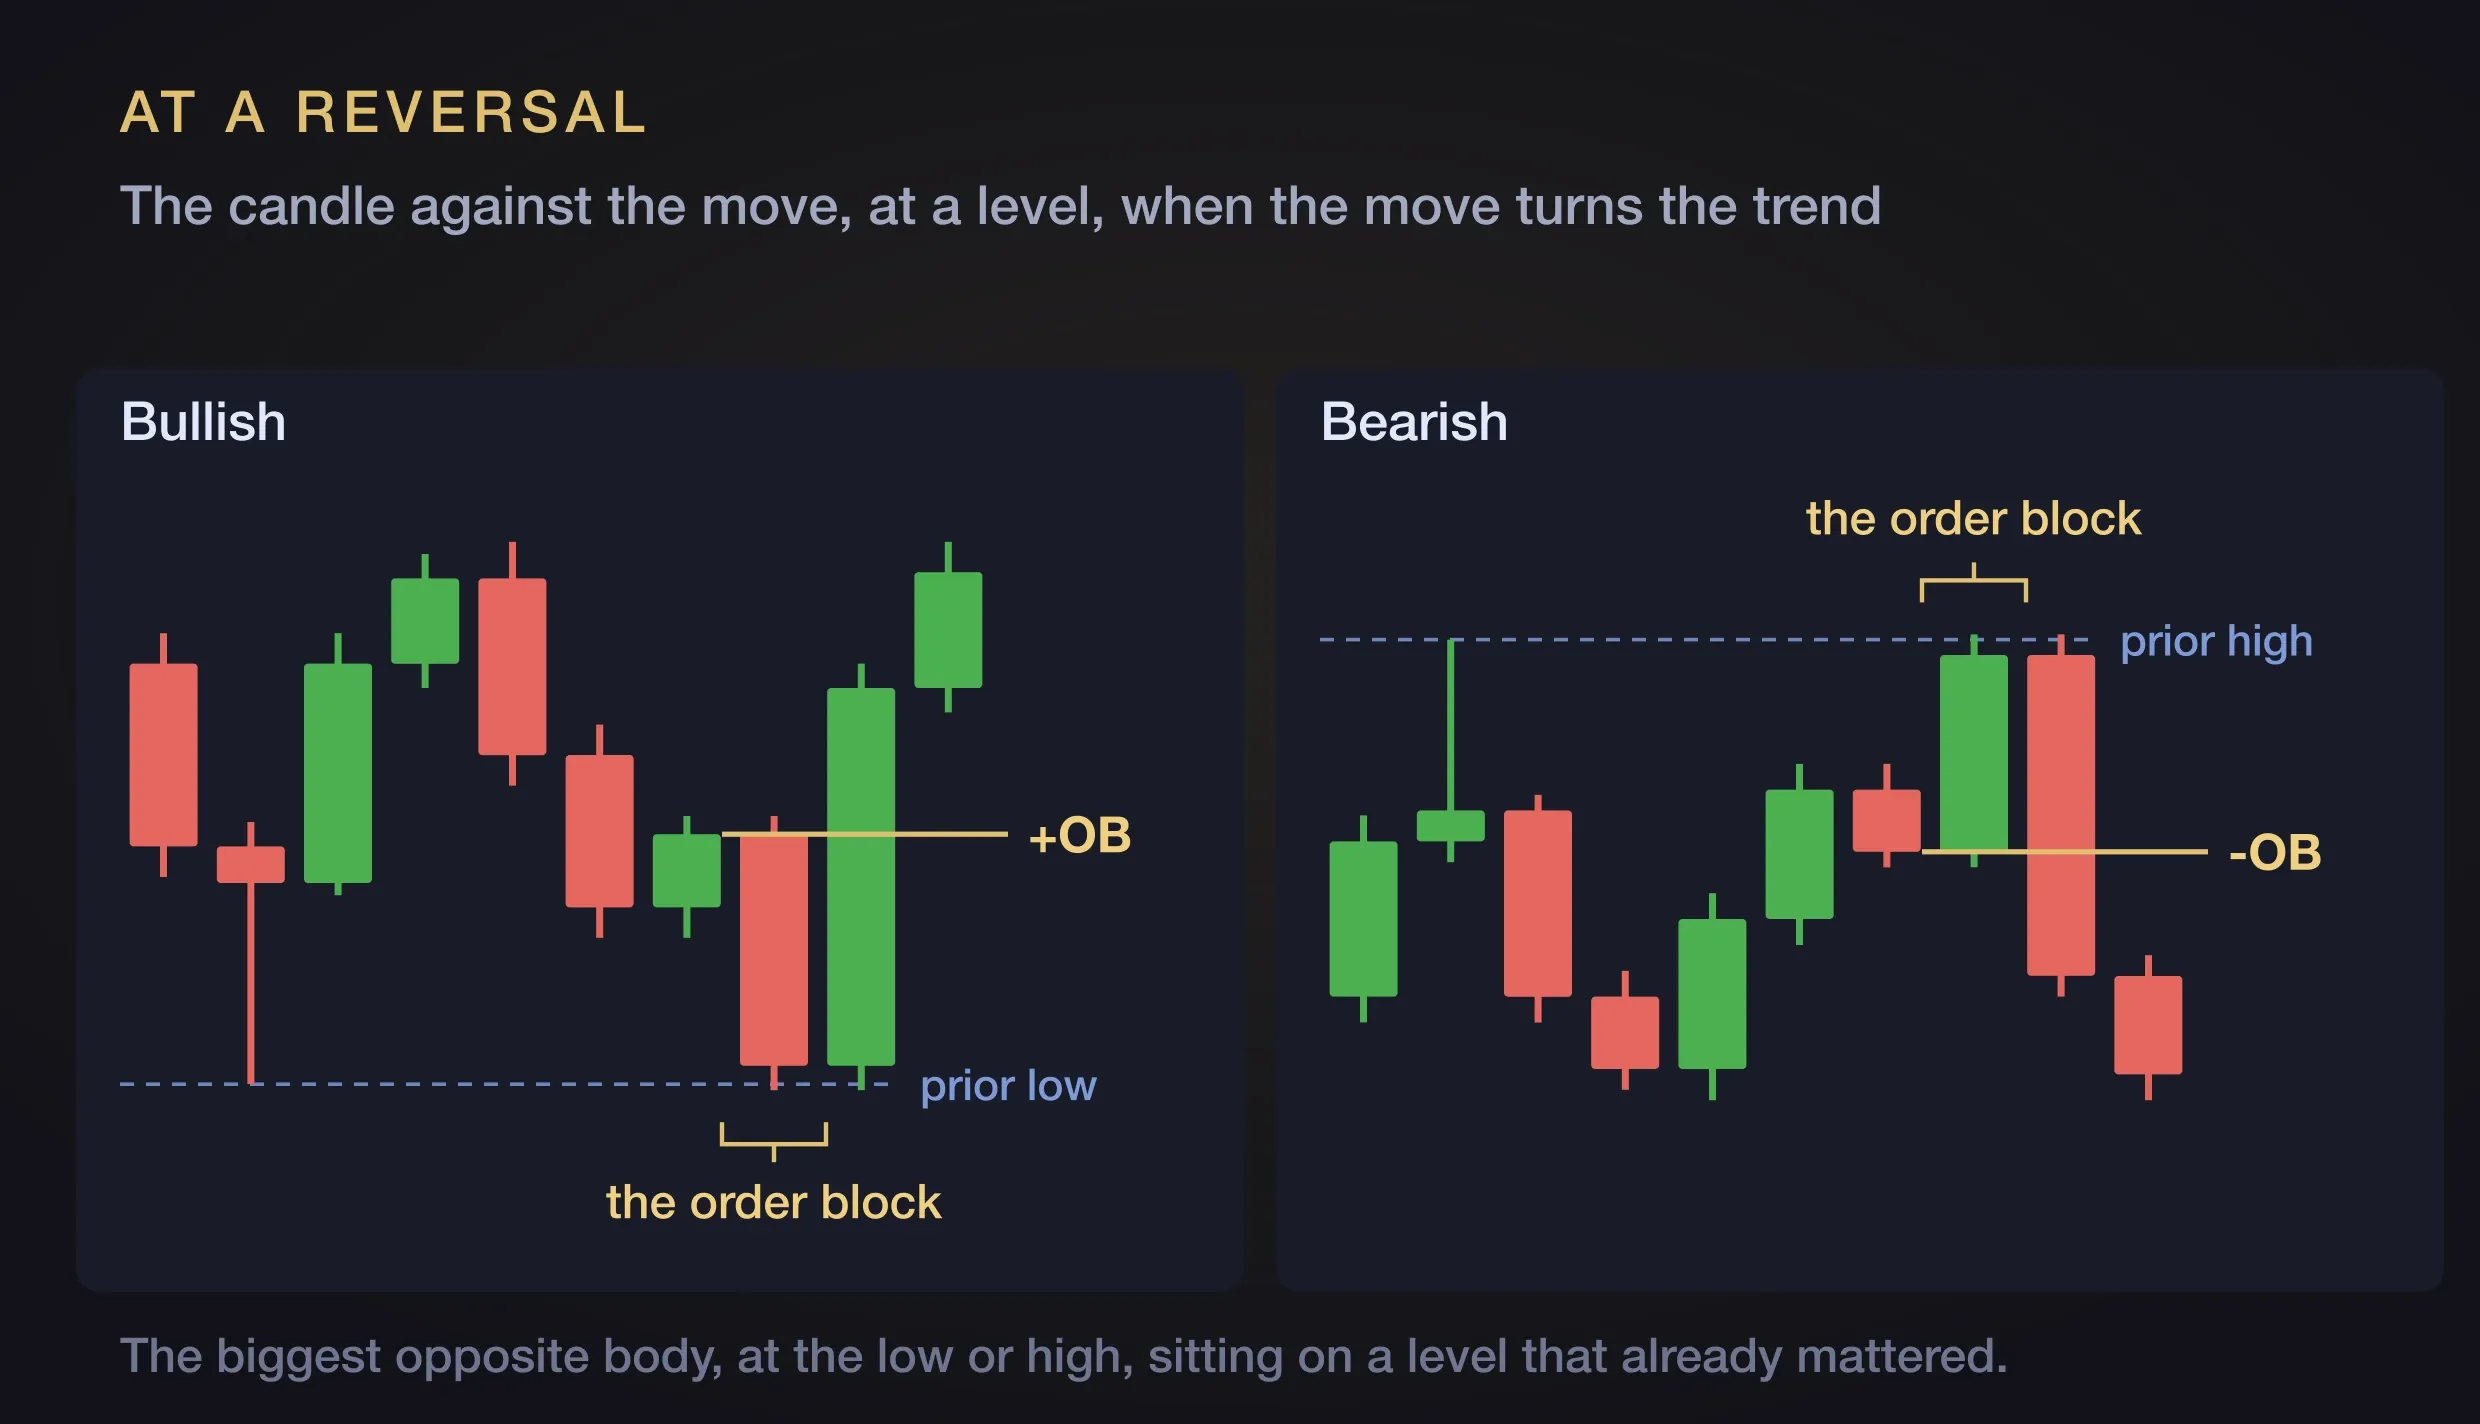
The original definition has three parts to it. For a bullish order block it looks like this:
- It is the lowest down close candle in a price range.
- It has the biggest distance between its open and close price.
- And it sits near, or at, a previous support level.
This is more selective and means that not all down close candles are order blocks.
A key distinction is lowest and not last. Where several down close candles sit in the same area, you want the one that made the low, which is not always the last one before price turned.
The most range between open and close. The biggest body in the area, measured on the body and not the whole candle. A small indecisive candle that happens to close down is not the one.
Near a support level. It has to sit at a level that already meant something. A pullback in the middle of open space does not qualify no matter how the candle closed.
Now let’s cover the 2 types of order blocks:
- A bullish order block. (This is the down close candle before higher price movements)
- A bearish order block. (This is the up close candle before lower price movements)
One extra condition (apart from the 3 mentioned above) needs to happen before a candle is confirmed as an order block. Price needs to trade past and close beyond the candle. If price closes above, it becomes a bullish order block. If price closes below, it’s a bearish one.
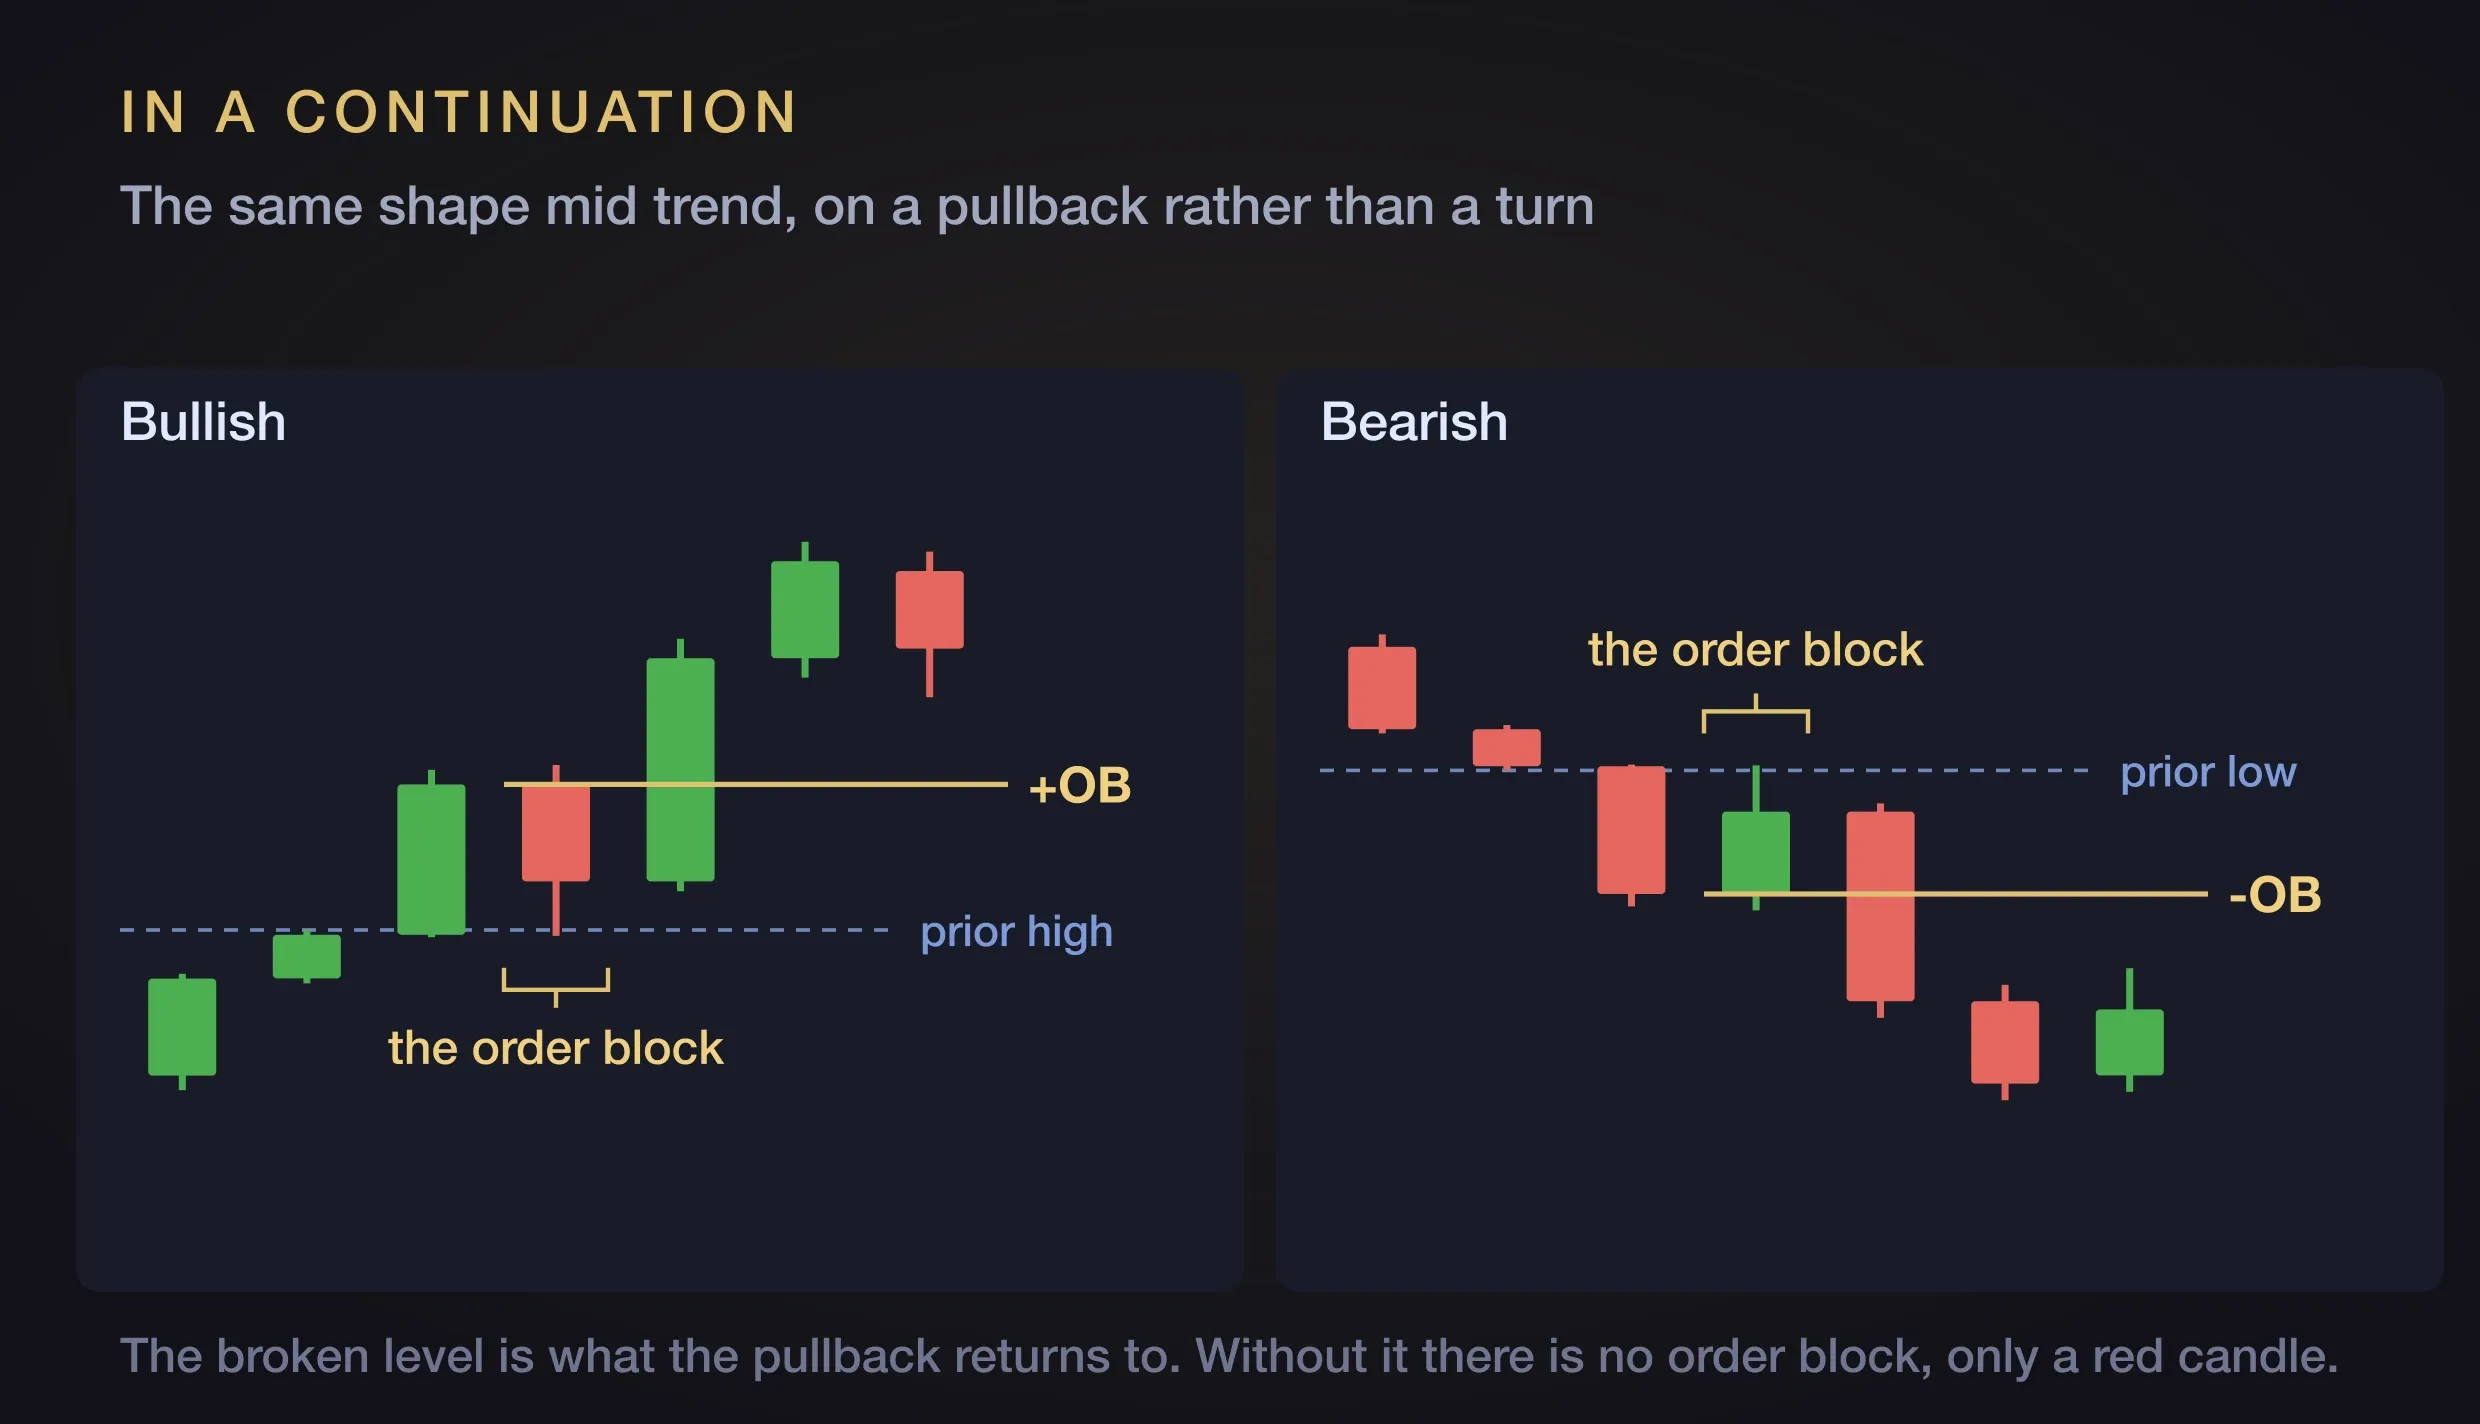
The same concept turns up in the middle of a trend, but from a pullback or consolidation rather than a directional change. Nothing has to reverse for the candle to become an order block.
When a series of candles ran in the same direction prior to a change in price movement, they do not give you multiple separate order blocks. The group of same colour candles are merged together to become one order block.
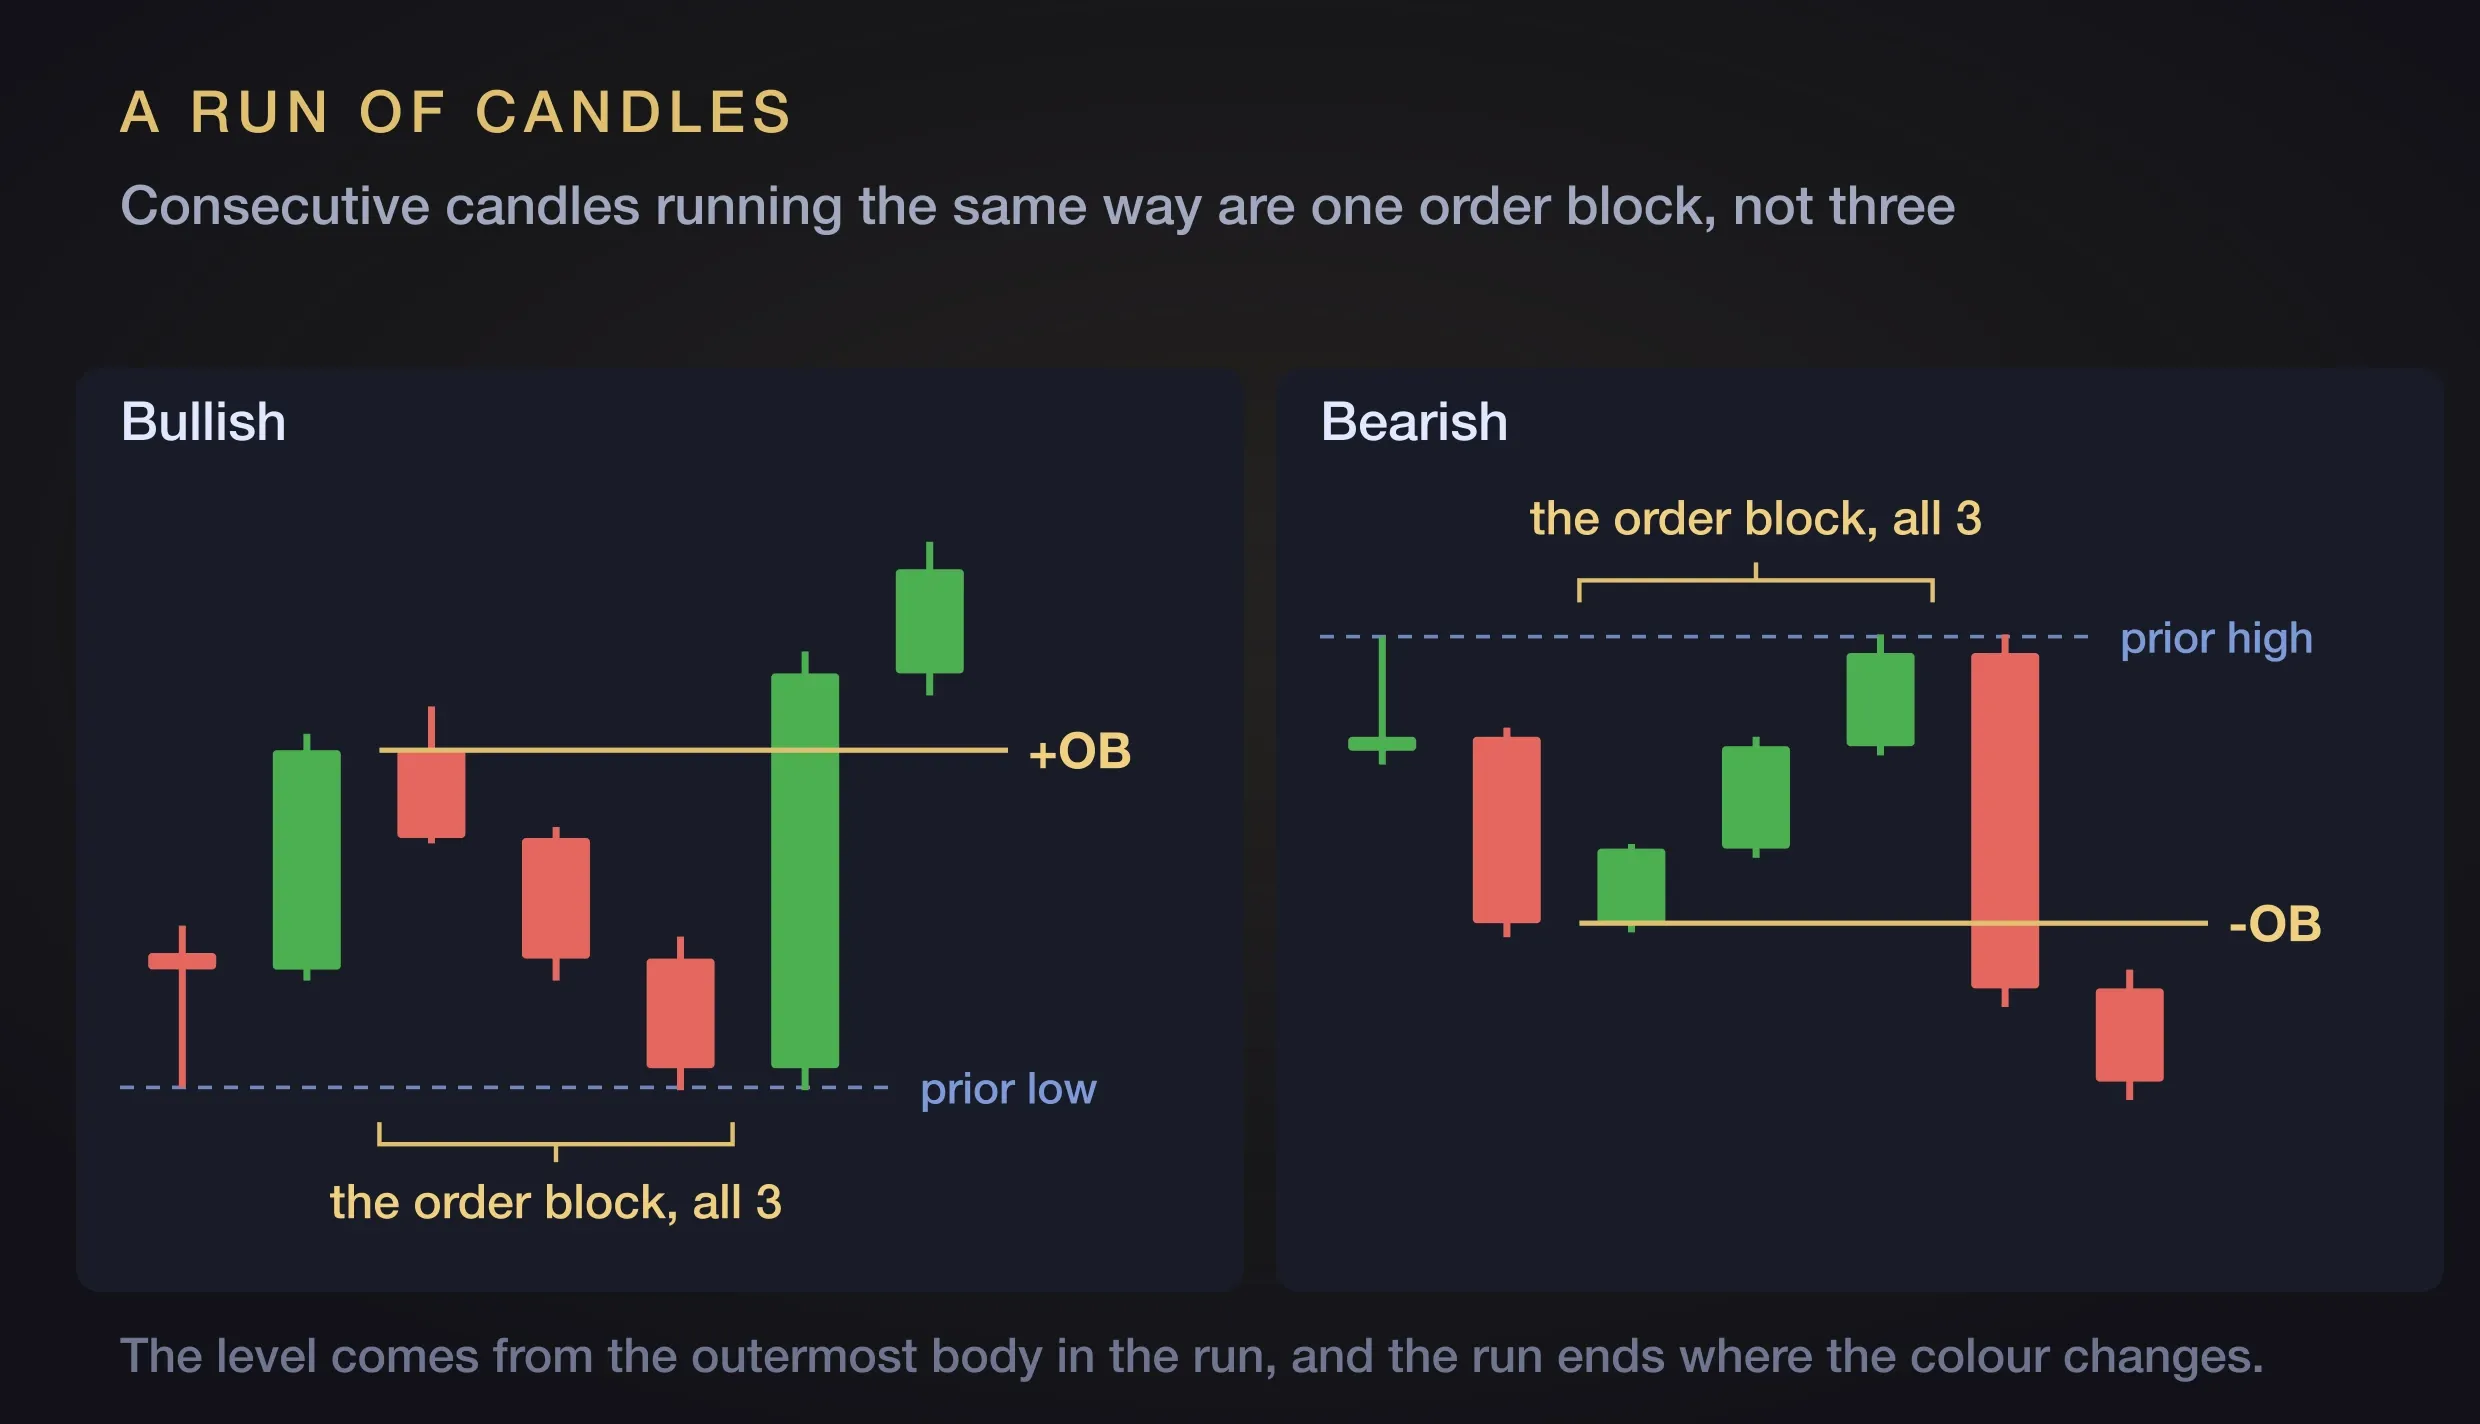
The term comes from ICT (aka Michael J. Huddleston, or the Inner Circle Trader), whose teaching is where most of this vocabulary originates. You will see them written as +OB for bullish and -OB for bearish, which is ICT’s own shorthand.
The narrative attached to the concept is what separates it from a line drawn at a convenient price. A run of red candles inside an uptrend might look like weakness to retail traders. ICT reads it as the opposite. Smart money participants are building up their long positions while traders who think the move has topped enter into shorts. Those traders are providing the liquidity for smart money to get in. When price accelerates back up, those shorts get stopped out.
The order block is not just a pattern on the chart, but also a mark left to be able to read the bias or order flow. If price keeps getting supported by order blocks on the way up, or turned away by them on the way down, the concept says your bias is still intact. When one stops working, it is likely the trend has entered into a new phase.
How to mark one
Three separate things get blurred together here, and pulling them apart makes the rest of this much easier.
First, what the order block is. The order block is the whole candle, high to low. Not a band inside it, and not the body alone. Where several same-direction candles formed the run, the order block is all of them.
Second, how it gets drawn. Most traders draw a single horizontal line at the level they care about. Some draw a rectangle over the whole candle instead. Both are common and neither is wrong. The line is a drawing convention, not the definition, which is why two people can mark the same order block and produce charts that look slightly different.
Third, which prices act as levels. Two get used most of the time.
For a bullish order block, formed by a down candle, those are the candle’s high and the top of its body. For a bearish order block it is the mirror image: the candle’s low and the bottom of its body. You draw one of them, not both.
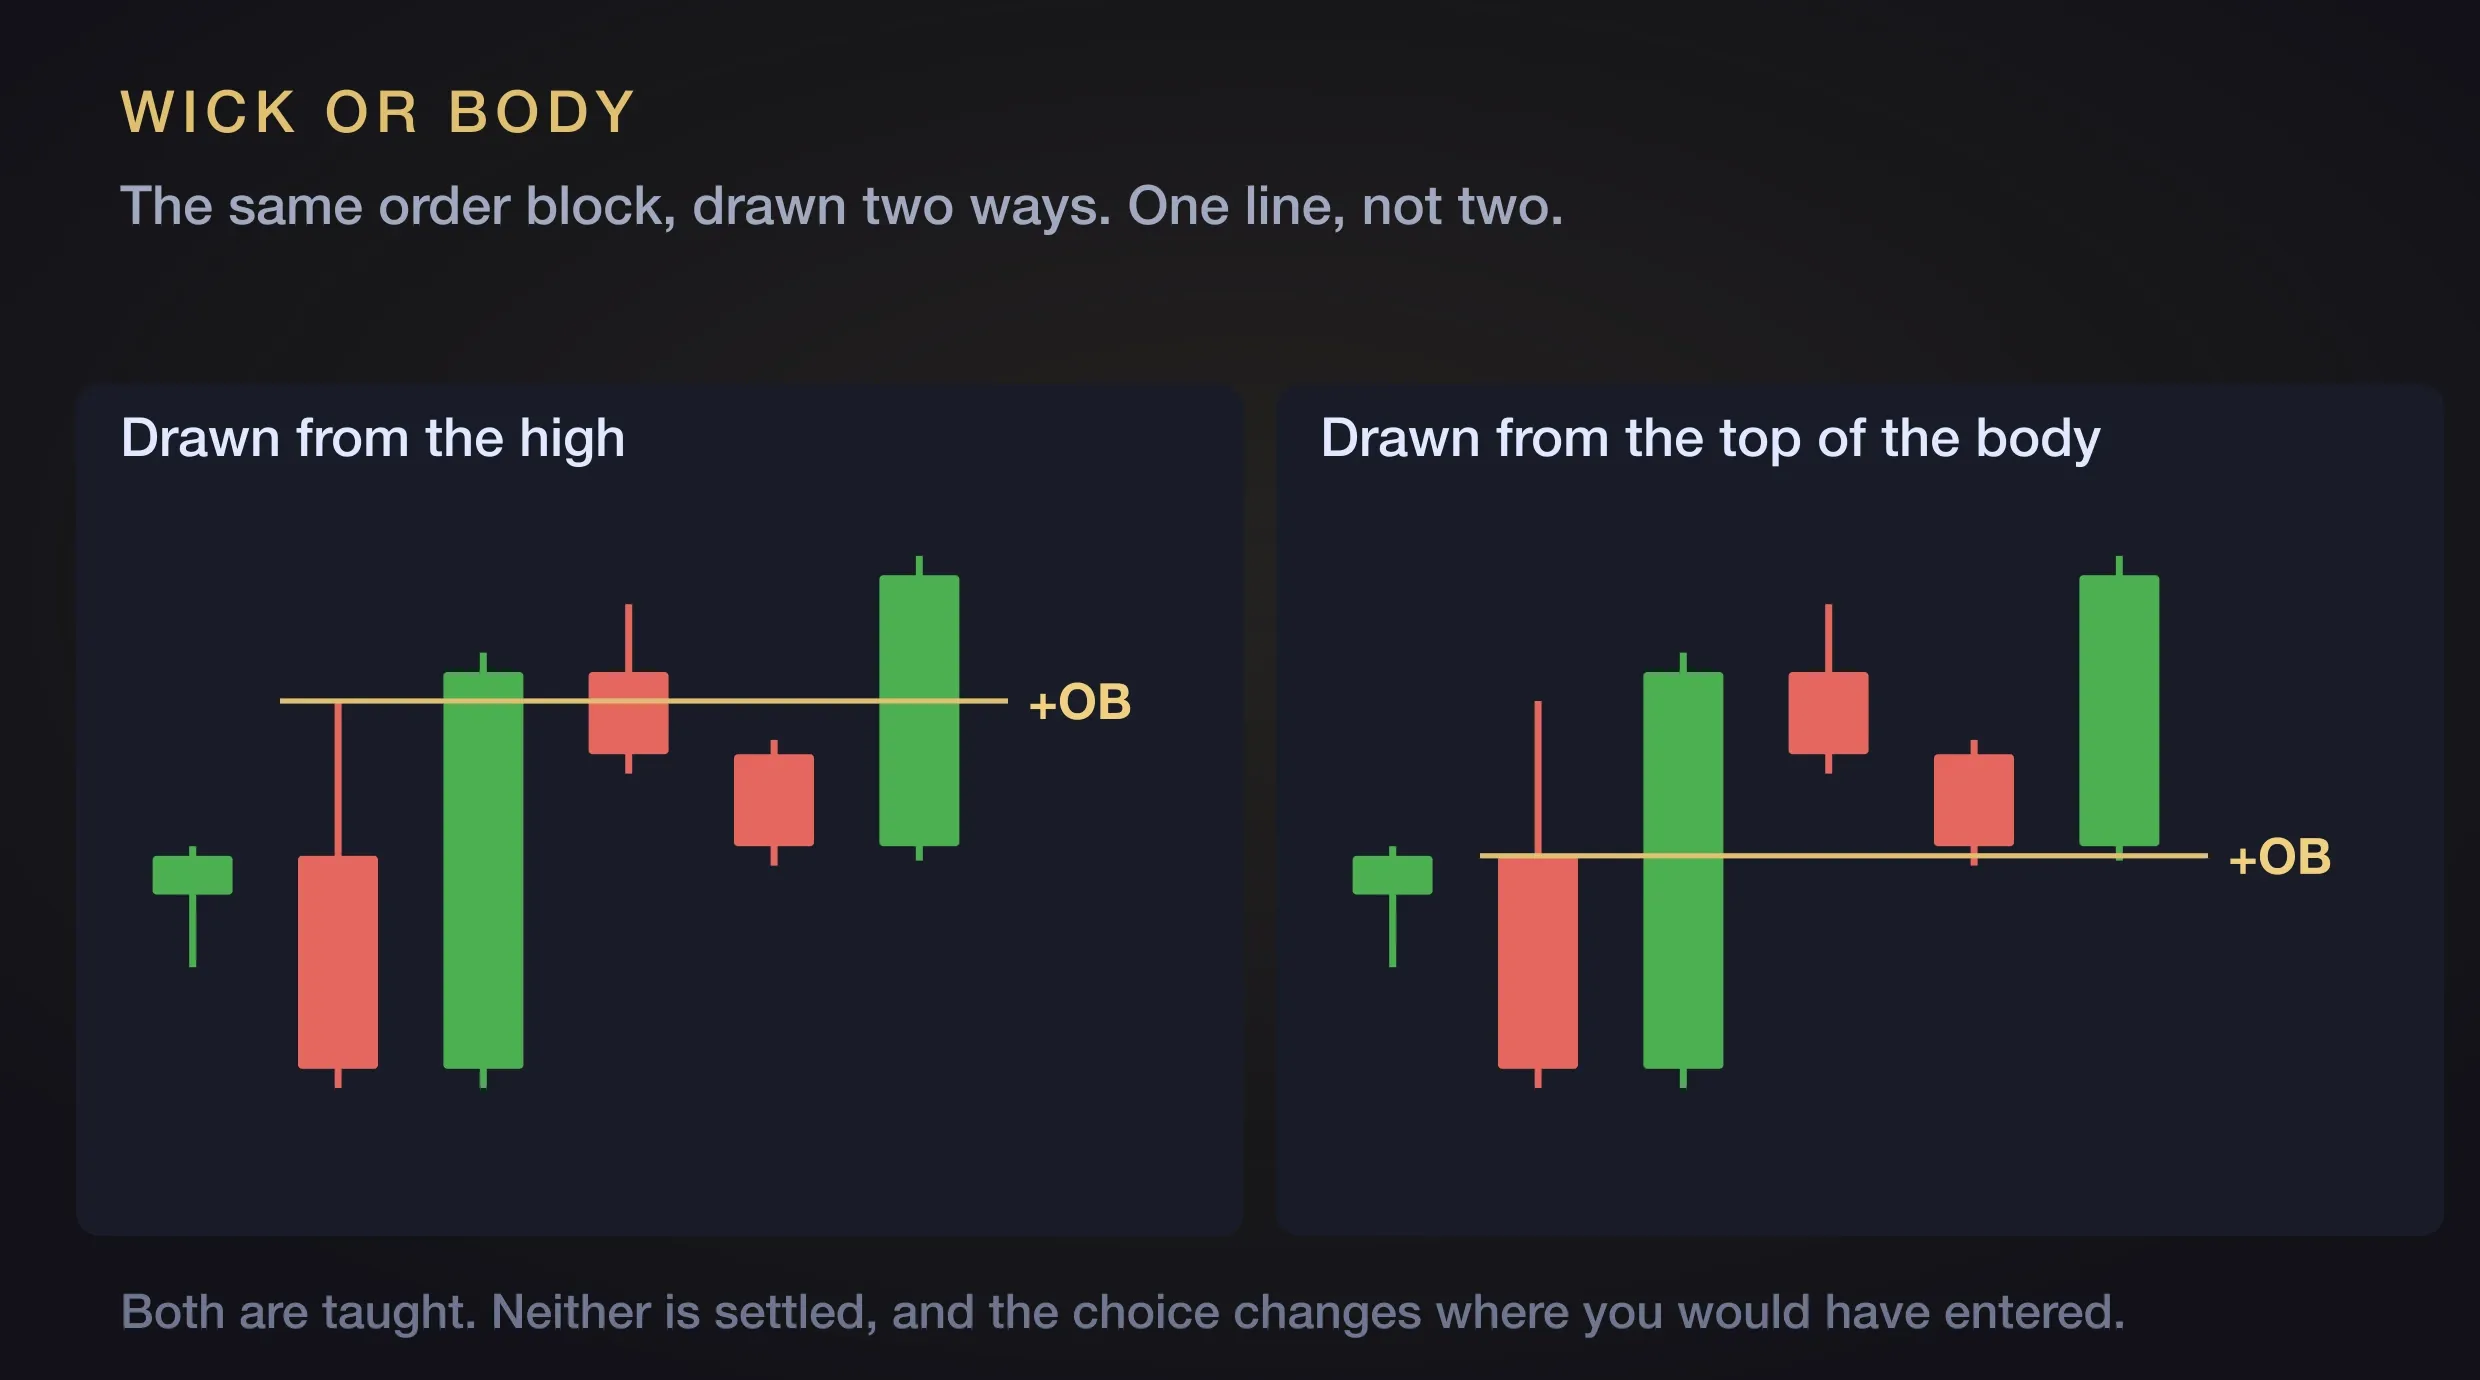
Those two levels are not a brick wall. Price will often paint into the wick or body and neither is a failure. The level is the earliest point at which you could get in, not a line price is obliged to respect. It is important to note that you will not know in advance how far into an order block price will actually go. Taking the earliest level is the conservative choice, which is how ICT teaches it.
When the upper wick is long, it can be further split into quadrants at the twenty five, fifty and seventy five percent marks inside. Price may respect or react off one of those quadrant levels.
The wicks do the damage and the bodies tell the story.
ICT (Michael J. Huddleston)
Wick or body? The part that is somewhat vague
Here is where the tidy explanations run out.
You will be told to enter at the candle’s high, and you will be told to enter at the top of the body, and both instructions come from the same source. ICT uses the wick and the body interchangeably, in different examples, without giving a firm rule for when to use which. He has addressed it in his teachings, but the answer comes out closer to “it depends” than to a precise rule.
This leads to the next one. A common piece of guidance is that price should not close below fifty percent of the order block. Fifty percent of what, though? The order block is the whole candle, so the whole candle is what the definition points at. But plenty of traders measure the body instead, and the source material does not settle it.
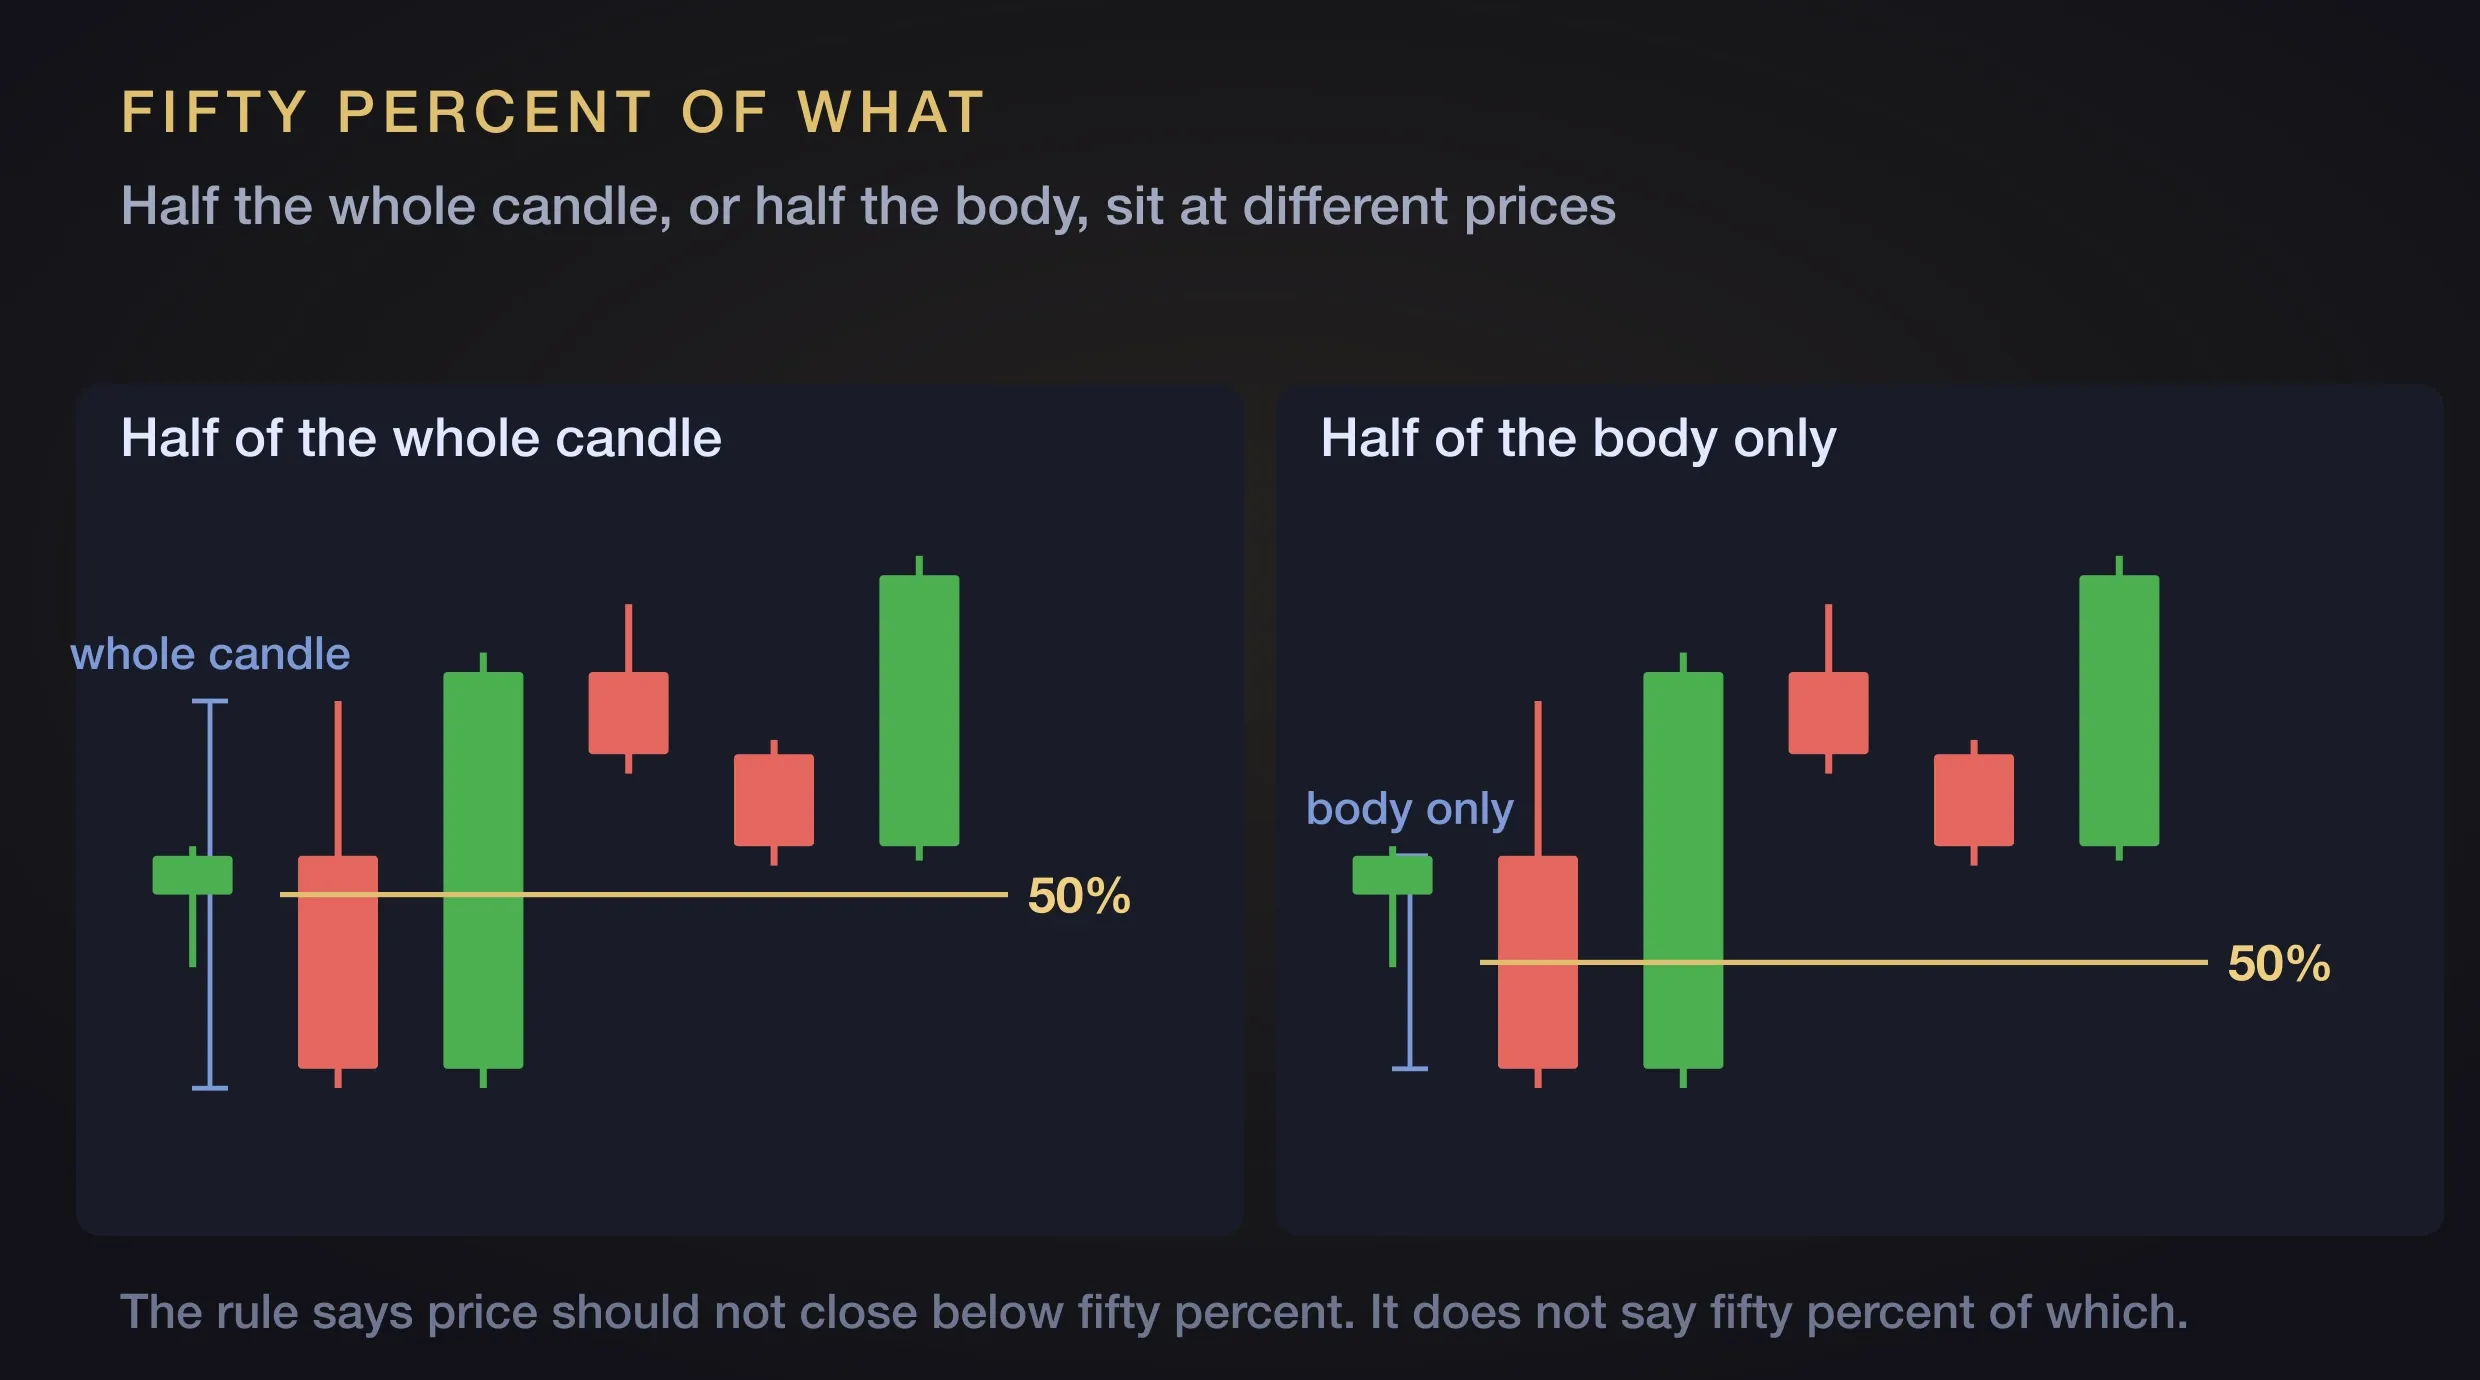
Some people have built more on top of the ICT order block. The quadrant levels inside a long wick are watched for reactions, and price wicking into an order block without reaching the body is held to be an especially strong signal. Those are claims, not findings, and you should backtest them independently to get at the truth.
None of this is resolvable by reading one more explanation. It is resolvable by marking a few hundred of them in the charts and measuring what happened next.
When is an order block still valid?
A order block does not get used up. Price can return to the same one repeatedly, and repeated taps that hold are evidence the level is doing something rather than a sign it is worn out.
A wick through the order block does not kill it either. What matters is where a candle closes. Price can run the full depth of an order block with a wick and keep going in the original direction, often because some inefficiency below it needed to be traded into first.
Closing beyond the halfway point is better understood as a downgrade than as an invalidation. The setup is not dead. It has become less likely to work, and more likely to chop sideways or fail outright.
When one does fail, the honest list of reasons is short. A higher timeframe level with more weight behind it was missed. The chart was read wrong. Or it was simply one of the times the thing does not work, because nothing on a chart works every time.
Order blocks and fair value gaps
The two get used side by side constantly, so it is worth being clear on how they relate.
They are different PD arrays, and on the PD array matrix the order block sits above the fair value gap (FVG) in terms of strength. In addition, PD arrays can stack to give off stronger signals. So when a FVG forms inside or across an order block, you have both levels in the same place, and traders treat that overlap as a stronger area than either one alone. In such a case, either one can be used as the entry.
The same stacking logic extends further. An order block that sits inside a breaker block, and that has tapped a higher timeframe PD array, is treated as an even stronger read.
Order blocks versus supply and demand zones
Anyone who came up on supply and demand will look at all of this and say it is the same idea wearing different clothes. That deserves a straight answer rather than a defensive one, and the straight answer has two halves.
In a continuation, the two land in almost the same place. A rally, base, rally setup and a bullish order block routinely point at the same part of the chart. The difference is resolution. Supply and demand draws a zone across the whole base and waits for price to enter the band. ICT marks a level and waits for a specific price. Put the two on one chart and the order block’s level typically sits at the top edge of the zone, or inside it.
In a reversal, they genuinely diverge. The two methods pick different places, and the overlap argument stops holding.
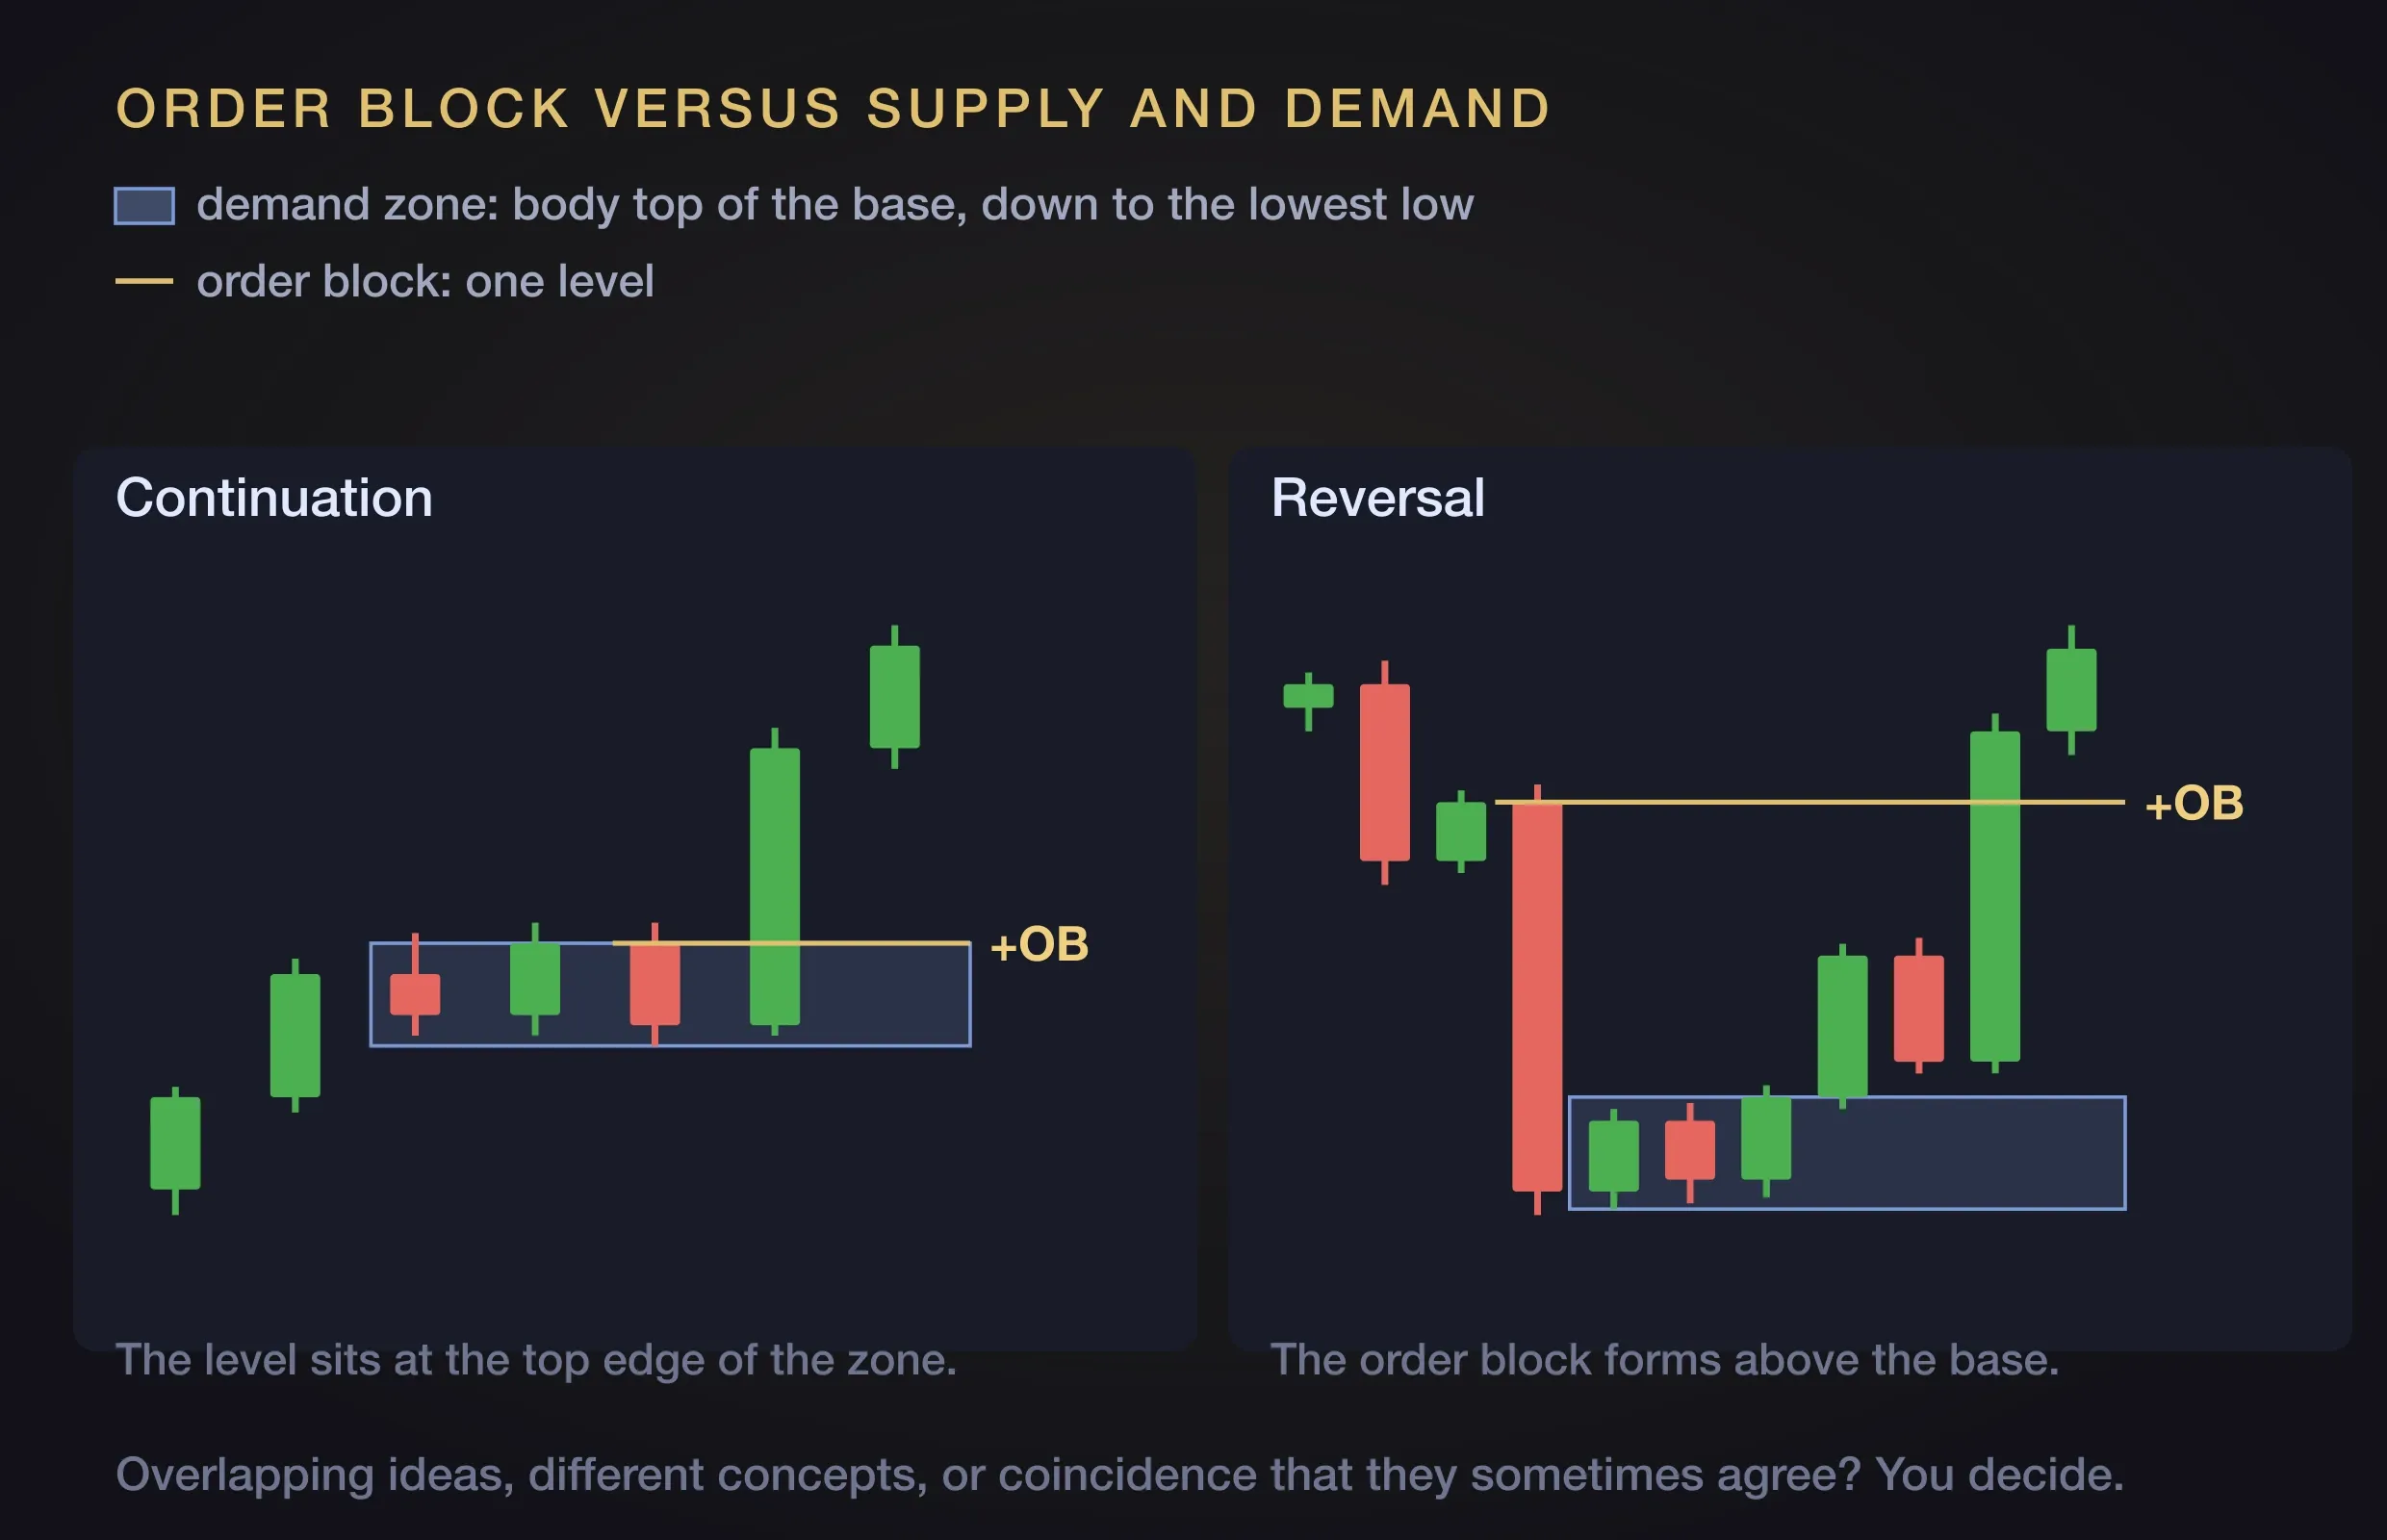
Underneath both cases sits a real mechanical difference, and it is not that one uses a group of candles and the other uses a single one, because both group candles. It is which candles and what gets marked. Supply and demand works from a base of sideways, mixed direction candles and draws a zone around it. ICT works from a candle, or a run of same direction candles, and marks a level.
The related objection is that all of this is just support and resistance renamed. Support and resistance lines get drawn in different places, and where one happens to line up with an order block, it might just be coincidence.
So: overlapping ideas, genuinely different concepts, or coincidence that they sometimes land together? You decide.
Bias comes first
An order block does not tell you which way to trade. It tells you where, once you already know which way.
Get the bias wrong and everything downstream is wasted. You will hunt bullish order blocks in a market that is going down, find plenty, and take avoidable losses at every one of them. The direction has to come first, from your read of the session or the day.
This is the part that gets lost when a concept is taught on its own. An order block is a concept. It is not a strategy, and it is not a bias model. ICT’s material is layered, with time of day, news and higher timeframe context all feeding the same decision, and one concept pulled out of that stack does very little by itself.
Timeframes work the same way. You take your bias and your levels from a higher timeframe and find your entry on a lower one, where “higher” is relative to wherever you are entering. You might mark your levels on the fifteen minute and take entries on the one minute, or work from the hourly and enter on the five. A four hour or weekly order block carries far more weight than a five minute one, and how long you expect to hold scales with it.
Where to place a stop and where to take profit are deliberately not in this guide. They belong to a trading model, not to the concept, and they depend on far more than the order block in front of you.
Do order blocks actually work?
Nothing above answers that for the thing you actually trade. Only a sample does.
Start by writing your definitions down, before you look at anything. The vague parts above are the reason this comes first. Leave them open and you will resolve them differently on different days without noticing.
- Is your level the candle’s high, the top of the candle body, or a mix of both?
- Is fifty percent measured on the whole candle, or just on the body?
- Does a close below fifty percent invalidate it? Or does it need to be beyond the order block?
- Which timeframe’s order blocks are you marking, and what is your higher timeframe?
- How do you combine a run of candles into a single order block?
Then pick one instrument and one timeframe, mark every occurrence including the ones that failed, and record what price did at each:
- Did price ever come back to it? How often does it return?
- Touched the wick only and not the candle body?
- How many times did it typically tap into an order block and hold versus fail?
- How often does price trade into the body and react?
- How frequently does price wick all the way through, but still closed inside, and continued?
- Closed beyond the halfway point, then recovered vs failed?
How many do you need to look at before the result means anything? BacktestingLab has a free tool for working out the sample size based on an expected range. It is meant for trades, but it also applies to testing concepts as well.
Doing this by hand on TradingView is where most traders quit, and reasonably so. Marking hundreds of order blocks candle by candle, logging each outcome, and holding your definitions steady across the whole sample is slow, repetitive work, and it is the exact point at which “I’ll just trust it” starts to sound like a plan. This is a shame, because the questions are important ones and the data needed to answer them is already in your chart.
If you are thinking..
There has to be a better, faster and easier way to do this!
You are right. It is one of the reasons BacktestingLab is being built. Its creator, David Nowak, came to trading from a programming background, and believes a question you can answer in seconds with code should not take multiple weekends with a mouse.
The vision is to have the software automatically mark up every order block occurrence in your dataset that meets your specific conditions, and lets you filter the results by what you want. So the patterns that appear invisible when you go through one chart at a time, show up once the whole sample is in front of you.
Until the software is publicaly available, the work is still worth doing by hand. Because the alternative is trading a concept without knowing its statistical strengths and weaknesses.
Where this fits
The order block is one concept inside one approach to trading. Learning it properly is worth doing, and it is still only the first stage of turning a concept into something you can rely on.
If you want the wider path, the five stages from learning an approach through to trading it live are laid out in how to become a profitable trader.