What Is a Fair Value Gap?
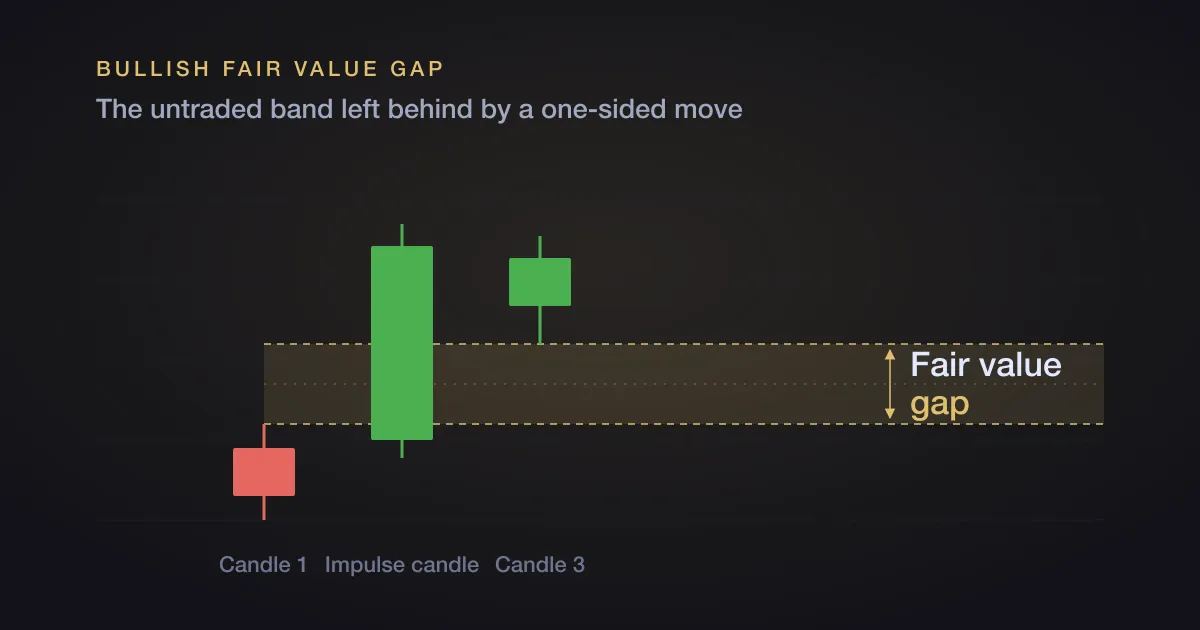
A fair value gap is a band of price that one side of the market skipped over. Price moved so hard in one direction that buyers and sellers never met in that range, and the three candles that produced it leave a visible hole on the chart.
Traders mark that hole because price has a habit of coming back to it.
What a fair value gap actually is
Take any three consecutive candles. If the middle candle is a large one-directional move, and the wick of the first candle does not overlap the wick of the third, the range between those two wicks is a fair value gap. Nothing traded there on the way through.
The term comes from ICT (aka Michael J. Huddleston, or the Inner Circle Trader), whose teaching is where most of this vocabulary originates. You will also see the same idea called an imbalance or an inefficiency, and in ICT material specifically as a buy side imbalance, sell side inefficiency (BISI) for the bullish case and a sell side imbalance, buy side inefficiency (SIBI) for the bearish one. They all describe the same three-candle structure.
The mental model ICT uses is painting a wall. You roll the paint upward in one fast pass and you cover most of it, but you move quickly enough that you miss a few spots. To cover those spots you have to come back down over them. Price does the same thing: an aggressive run leaves patches it never properly covered, and it tends to come back down to finish the job before continuing.
That is the whole concept. Everything else is detail about how to mark it and what to do with it.
How to spot one on a chart
The measurement is mechanical, which is the reason FVGs are popular: two traders looking at the same three candles should draw the same box.
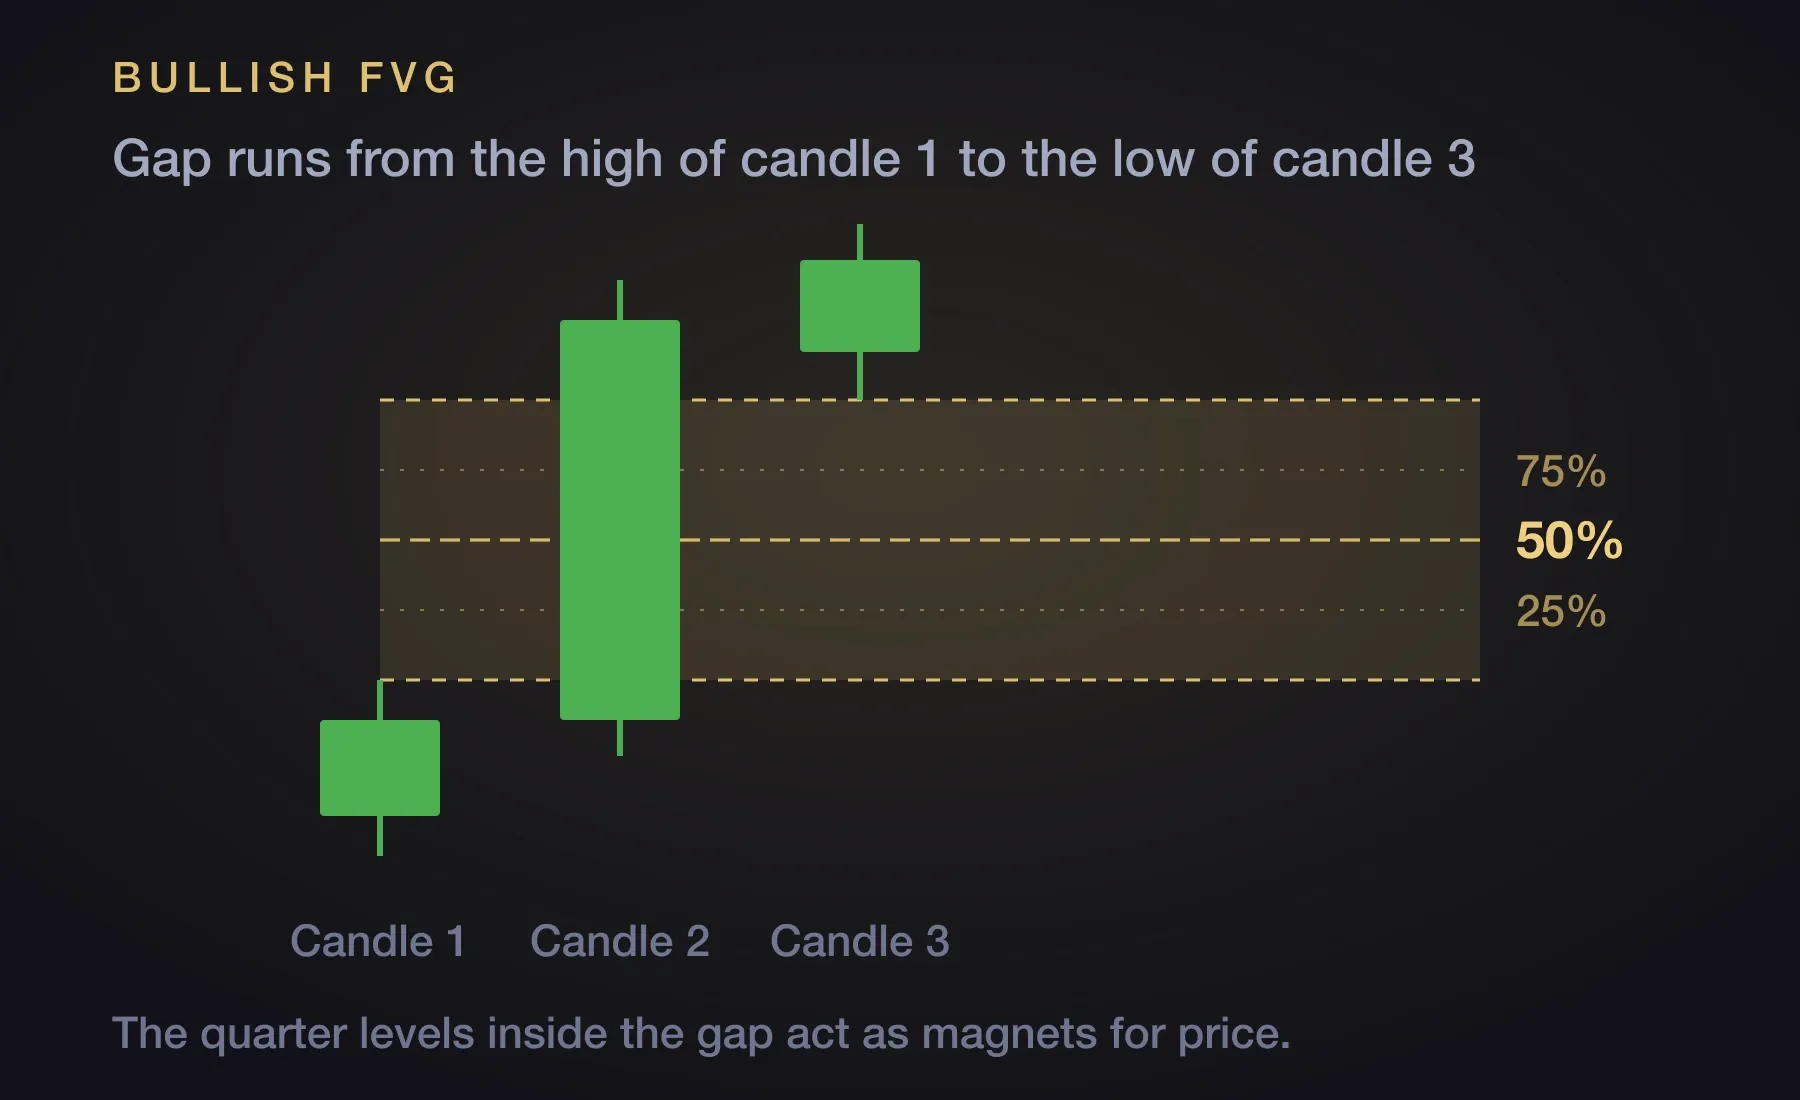
For a bullish gap, formed by a strong move up, the gap runs from the high of candle 1 to the low of candle 3.
For a bearish gap, formed by a strong move down, it is the mirror image: from the low of candle 1 to the high of candle 3.
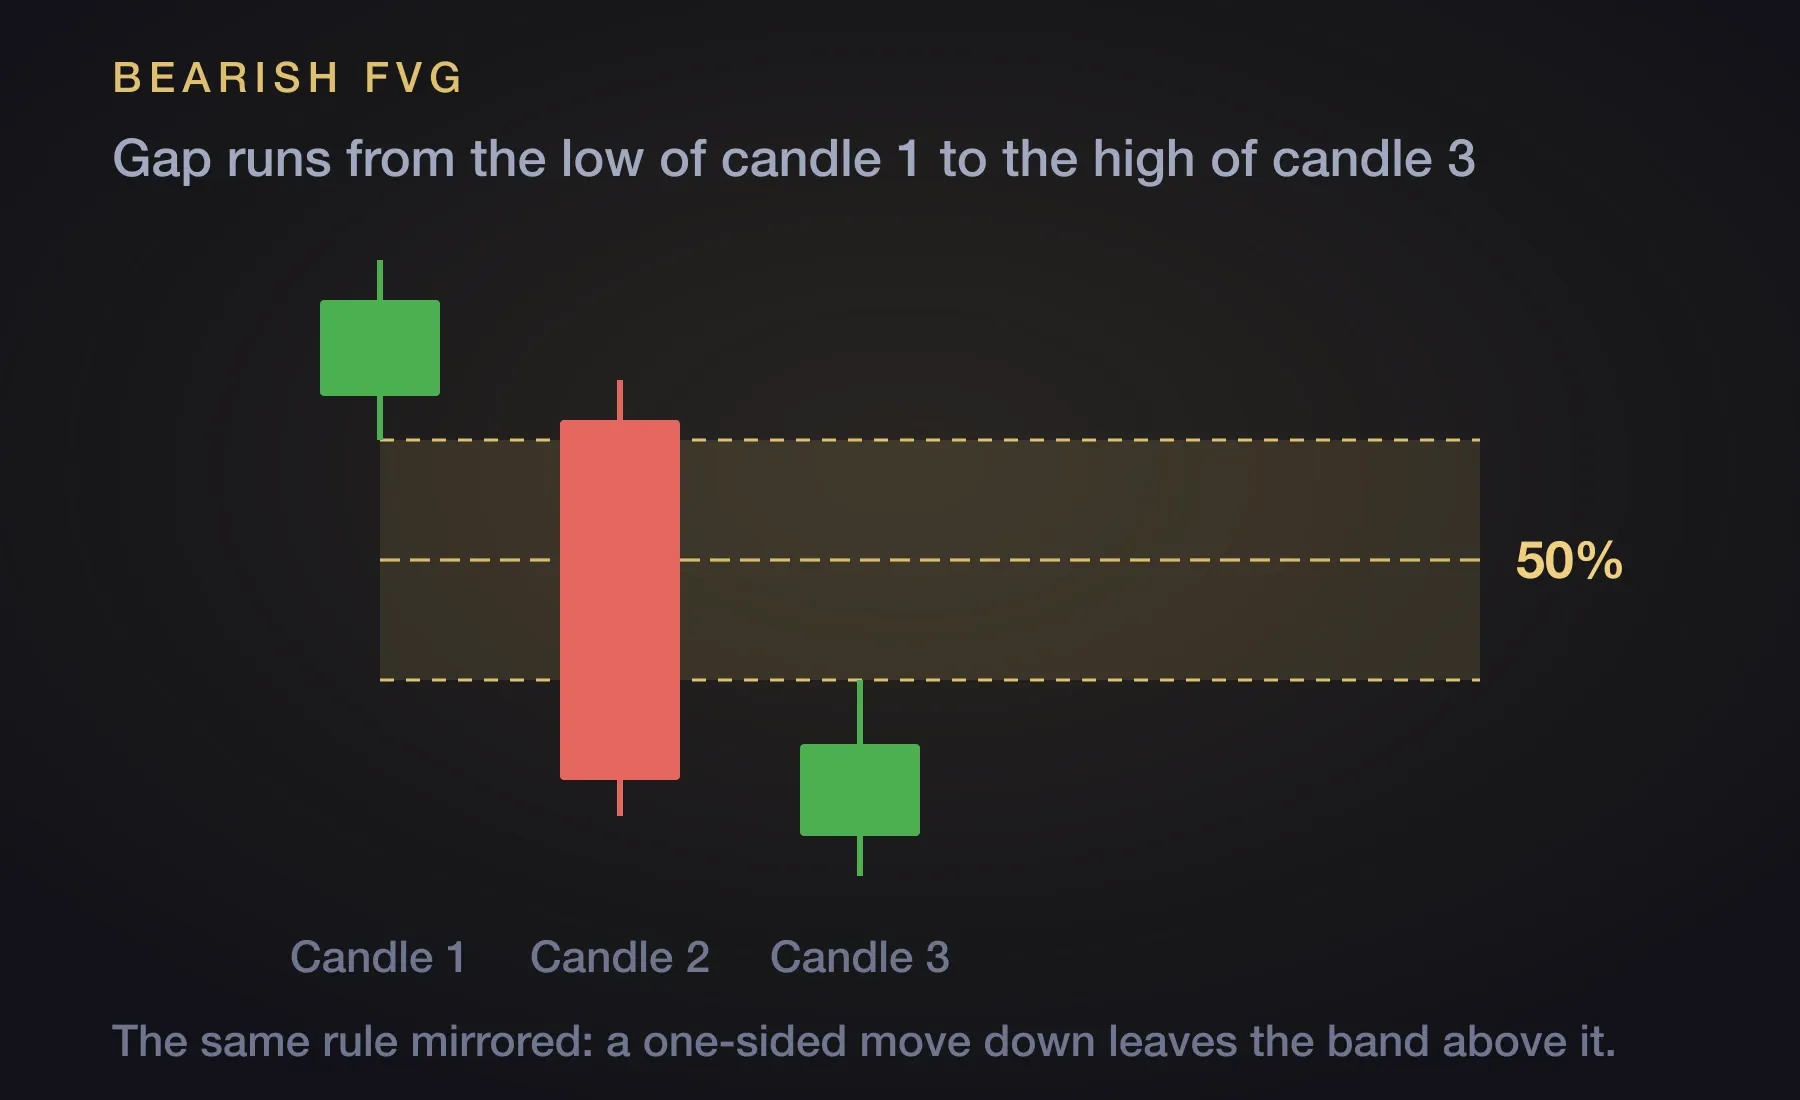
Two things people get wrong here. A big middle candle on its own is not a fair value gap, because if the outer wicks overlap then the range was traded and there is no hole. And the boundaries are the wicks, not the candle bodies, unless you have deliberately chosen a body-based definition and are applying it consistently.
Why price returns to the gap
The honest mechanism is unglamorous. A one-sided move means orders on the other side went unfilled at those prices. Participants who wanted in and missed, plus participants who need to manage positions taken during the run, both have a reason to transact in that untouched band. When price offers it back, there is business to be done there.
The part worth internalizing is that price rarely treats the gap as a single line. It reacts at levels inside it.
The midpoint is the one to watch. A reaction at 50% is common enough that many traders treat it as the level that matters most inside the gap. The quarter levels, 25% and 75%, behave the same way to a lesser degree. Treat all of them as magnets: areas that draw price in and then frequently reject it, rather than lines that guarantee anything.
There is a useful read in the opposite case too. In a strong continuation run, you generally want to see fair value gaps stay open, or get touched only shallowly. A market that is trending hard leaves gaps behind and does not go back to fill them all. When price turns around and fully closes a gap it left minutes ago, that is a different market than the one you thought you were in, and the run has lost the one-sidedness that created the gap in the first place.
How traders use them
The common application is straightforward. A trader waits for price to return into a gap that sits in the direction of their bias, takes an entry as price reaches it, and places the stop beyond the far edge of the gap so that a full close-through invalidates the idea.
On entry placement specifically, ICT teaches taking it right at the edge of the gap: the top of the gap for a bullish setup, the bottom for a bearish one. The reasoning is practical rather than theoretical. If you hold out for a deeper fill at the midpoint or the far side, price frequently reacts before it gets there and you watch the move leave without you. Entering at the edge accepts a slightly worse level in exchange for actually being in the trade. That the midpoint often produces a reaction and that waiting for it is a good idea are two different claims, and only the first one is well supported.
The more useful application is as a filter rather than a trigger. A fair value gap on a higher timeframe gives you a zone and a bias; the lower timeframe is where you decide whether to act on it. Marking every gap on a 1 minute chart and trading each one is not a strategy, it is a way to take a lot of trades.
Often ICT traders will layer concepts together for stronger entries. One example might be combining a fair value gap after a liquidity sweep with an order block. The confluence of ICT concepts in an area is seen as a stronger signal than any one alone.
Price is delivered to areas of inefficiency.
Michael Huddleston
Whether you take the edge every time, or wait for a confirmation on a lower timeframe, is exactly the sort of decision that has no correct answer in the abstract. It has an answer for your instrument, your timeframe, and your session, and you find it by testing.
Where fair value gap trading goes wrong
This is the part the average explainer skips, and it is where most of the money is lost.
Every chart has dozens of them. On a low timeframe, gaps form constantly. If your rule is “trade the FVG” you do not have a strategy, you have a permanently valid excuse to enter. Something has to narrow it down: a higher timeframe bias, a session filter, a requirement that the gap forms off a specific structural level.
Hindsight makes them look inevitable. Scroll back on any chart and the gaps that price respected are visually obvious, because you can see what happened next. The gaps price sliced straight through do not draw your eye at all. This is the single fastest way to convince yourself of an edge you do not have.
“Filled” has no standard definition. Does a gap count as filled when price touches the near edge, reaches the midpoint, or closes fully through the far side? These are three different rules that produce three genuinely different sets of results on the same data. Pick one, write it down, and apply it to every occurrence. Changing the definition partway through your review is how a mediocre result gets massaged into a good one.
Instruments do not behave alike. A 24 hour currency pair, an index future around the cash open, and a stock that gaps overnight on news are different problems. A gap-fill tendency that holds on one may not hold on another, and there is no reason to assume it transfers.
How to find out if they work for you
None of the above tells you whether fair value gaps are tradeable on the thing you actually trade. Only a sample does.
The process is not complicated:
- Pick one instrument and one timeframe. Do not mix.
- Write down your definition of a valid fair value gap and your definition of filled, before you look at anything.
- Mark every occurrence in the sample, including the ones that failed. This is the step that separates a real result from a highlight reel.
- Log at least 100 occurrences. Fewer than that and you are reading noise. Or use this tool if you want to know the precise number of how many you actually need.
- Record what price did at each one: never returned, touched the edge only, reacted at a quarter or the midpoint, closed fully through, or reversed against you.
Then read the outcome against the risk-to-reward you would realistically have taken, not the best exit available in hindsight.
Doing this on TradingView by hand is tidious. It’s a lot of work, but what would you gain from it? Knowing precisely when FVG’s fail versus work? Which FVG’s are important and under what conditions? All of that data would help you have more confidence as a trader.
BacktestingLab is being built to bridge that gap and make this process smoother, faster, better and more reliable. Its creator, David Nowak, came to trading from programming and believes a lot of backtesting ideas, concepts and trading & bias models should be mostly automated with the help of code.
Where this fits
The fair value gap is one concept inside one approach to trading. Learning it well is worth doing, and it is still only the first stage of the process that turns a concept into a strategy you can actually rely on.
If you want the wider path, the five stages from learning an approach through to trading it live are laid out in how to become a profitable trader.