How Many Trades Should You Backtest for Reliable Results?
Aim for about 385 trades. That gets your win rate to within a 5 point tolerance at 95% confidence, and a triple digit number should be your bare minimum that you aim for. Go below that and the results can be a bit cloudy about the strategy’s true performance.
A backtest is reliable when it passes three tests:
- Enough trades. The win rate should be a range you are comfortable with.
- Tested in more than one kind of market condition. That way one lucky stretch does not carry the entire result.
- It takes into account costs. The results should still be favourable once spreads and other fees are taken into account.
This guide is about backtesting to find out whether a model actually has an edge. Some people call this strategy development, but it is also backtesting. This approach involves testing a set of firm rules over a historical dataset to collect its past statistics.
It is not about doing practice reps, where you manually replay candles in a chart while pressing buy or sell to get better at spotting and entering into a model you already fully trust. These two backtesting approaches have very different purposes and jobs, and doing the wrong one wastes time.
What does a backtest result actually tell you?
A win rate from backtesting a model is just an estimate, and every estimate has a range around it. The range, not the headline number you see people share, is what you should judge a result by.
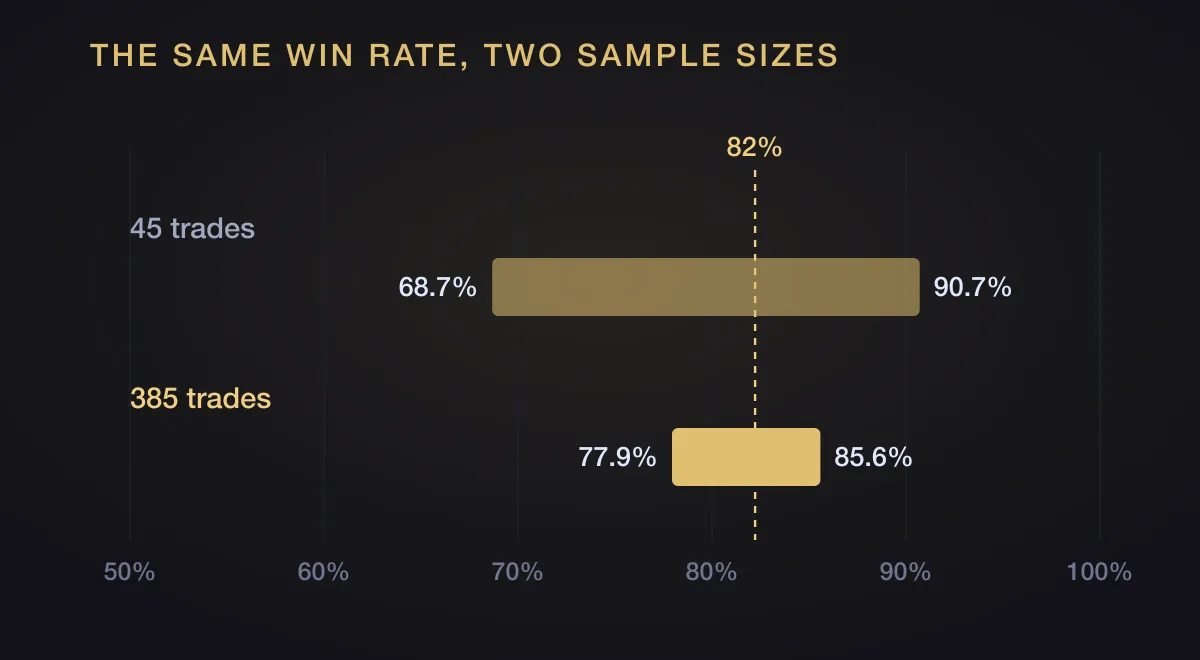
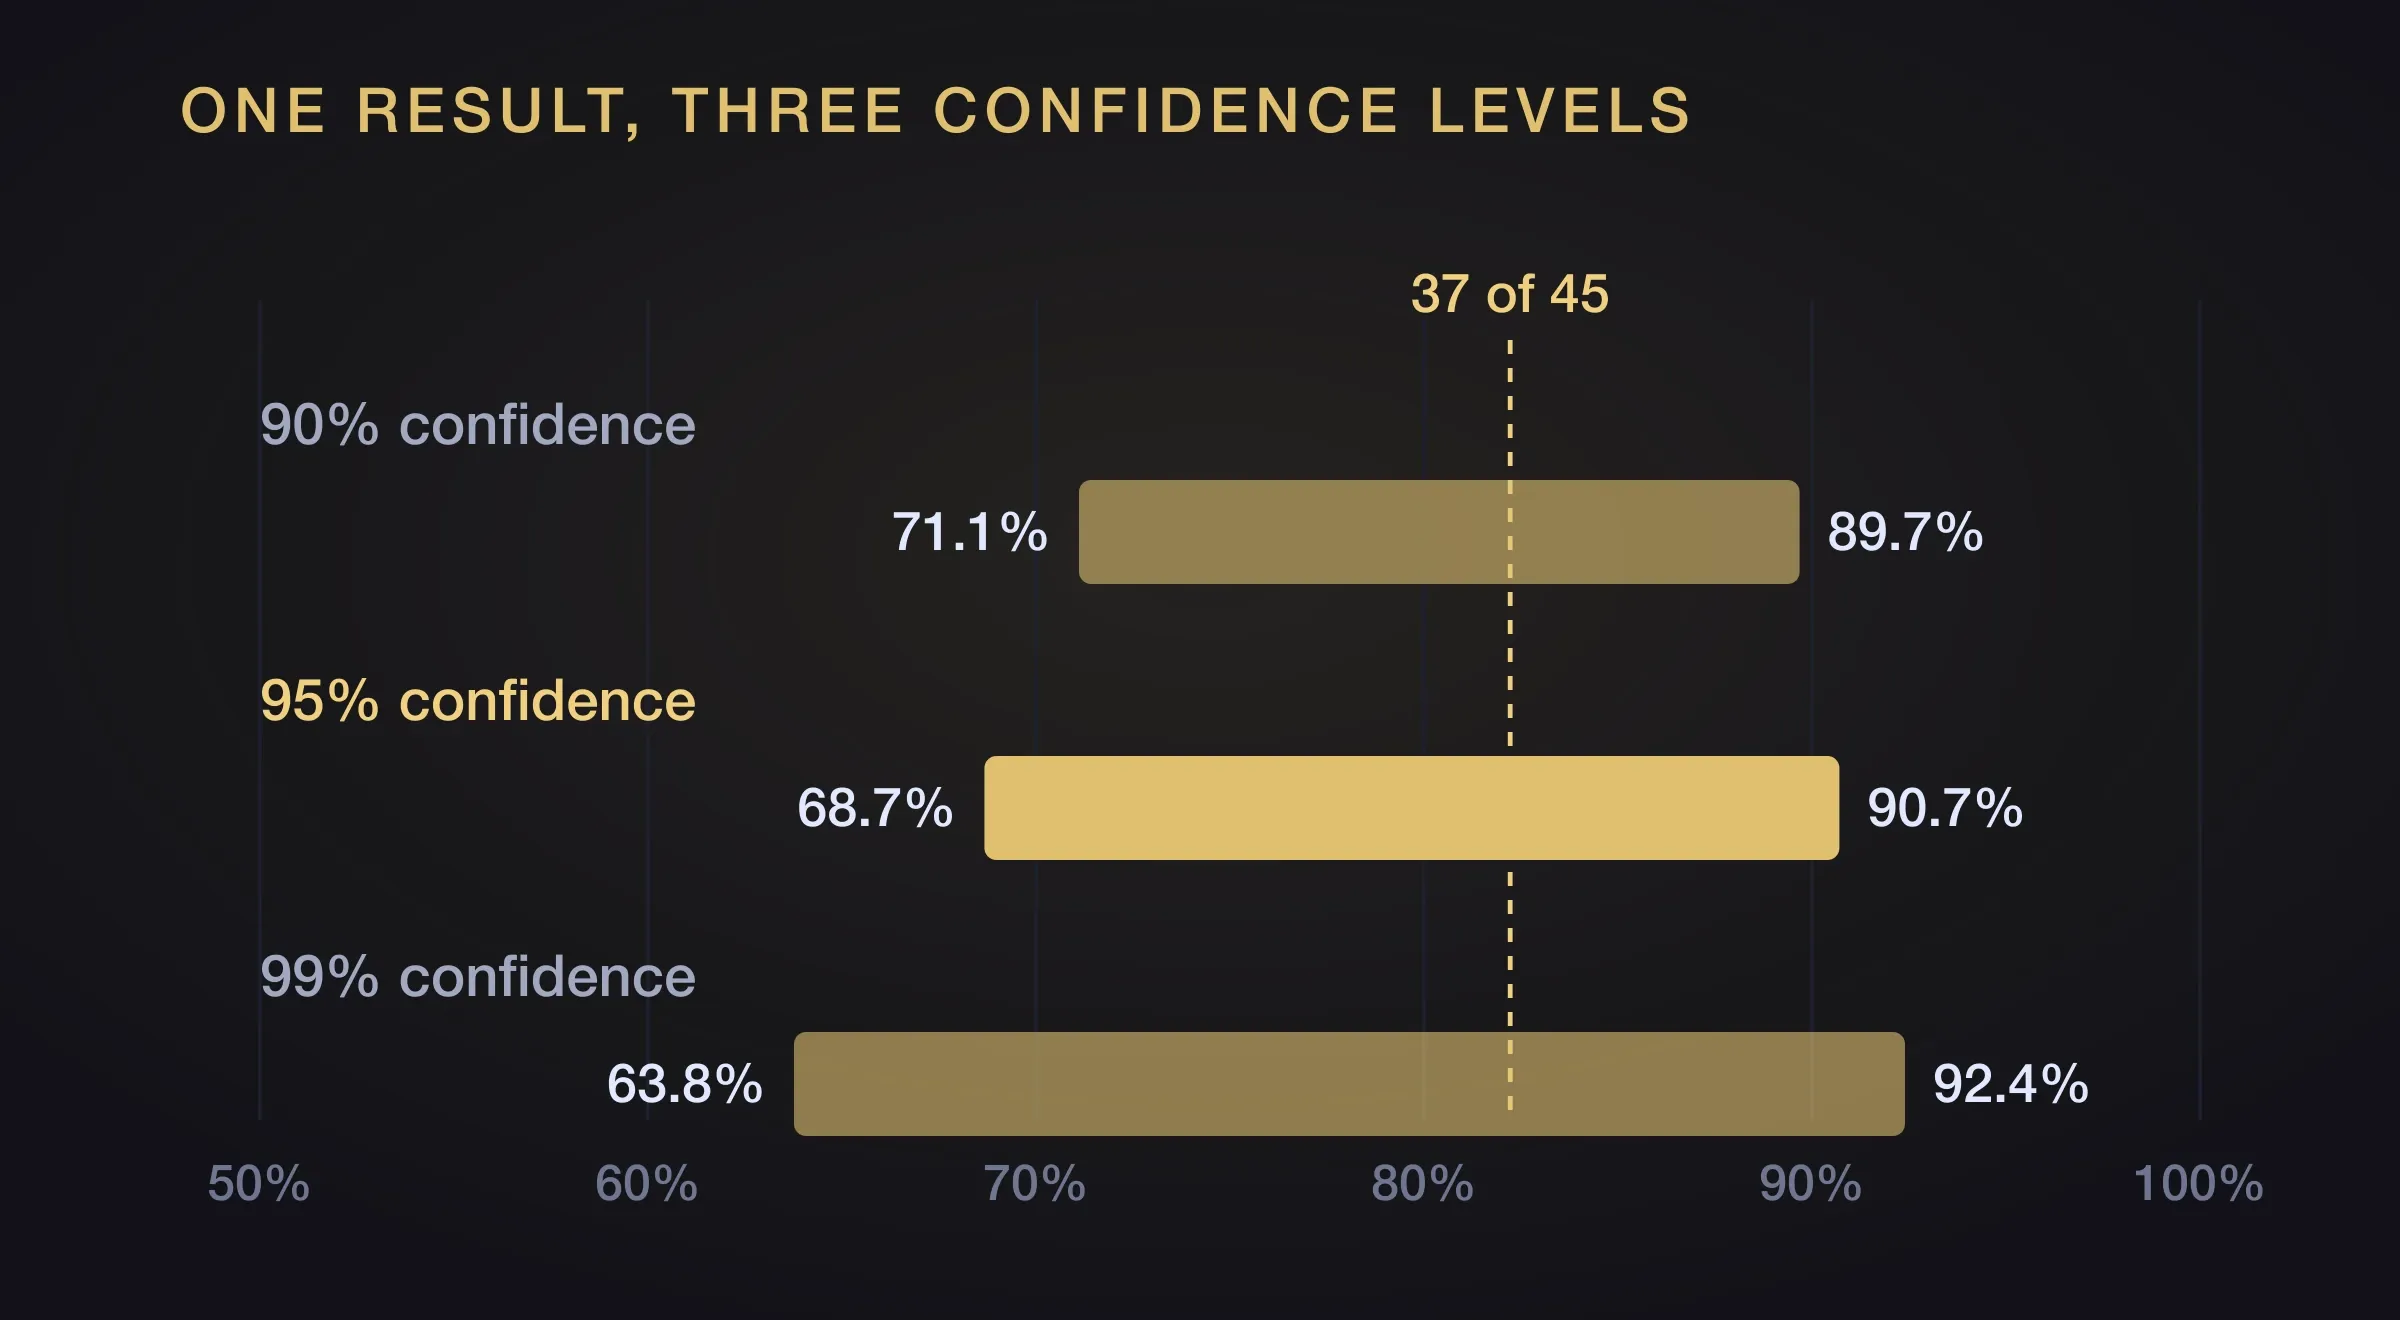
Take a trader who tests a setup for three months and gets 37 wins from 45 trades. That is an 82% win rate, and it feels like finding the holy grail. It isn’t. The realistic range for 37 wins from 45 trades is 68.7% to 90.7% at 95% confidence. The strategy could have an actual win rate of 69%, 90% or anything in between.
The problem is that 45 trades is simply not enough trades to tell you more precisely where the actual model’s win rate is at.
Run the same 82% win rate over 385 trades (316 wins) and the range tightens to 77.9% to 85.6%. It is the same win rate, but it has a different meaning. It is a much more reliable number.
You can try playing around with your own numbers in our very own win rate calculator. Simply enter the amount of trades taken, how many were wins and it draws the expected range for you. You’ll see the whole picture instead of just a single number.
The confidence level you choose moves the range too. Asking for more confidence means accepting a wider range from the same result, because you are covering more of the ways the sample could have misled you.
Small sample sizes can fool people in another way too. David’s own first backtest, done fully manually, was a setup he collected under 30 trades with. When it came time to trade it live, he never saw it occur again. His ‘edge’ may not have actually lasted long and the pattern stopped printing.
How many trades should you take when backtesting a model?
The answer depends on three things:
- How precise you want to be.
- How confident you need to be in your model.
- Roughly what win rate you are measuring.
The worst case is a 50% win rate, which needs the most trades. Other win rates need fewer. The table below is that worst case at 95% confidence.
| Margin of error | Trades needed | Where a true 50% win rate could end up |
|---|---|---|
| ±25 points | 16 | 25% to 75% |
| ±20 points | 25 | 30% to 70% |
| ±15 points | 43 | 35% to 65% |
| ±10 points | 97 | 40% to 60% |
| ±7.5 points | 171 | 42.5% to 57.5% |
| ±5 points | 385 | 45% to 55% |
| ±3 points | 1,068 | 47% to 53% |
| ±2 points | 2,401 | 48% to 52% |
That table comes from the same math as our own sample-size calculator, where you can change the confidence level and watch the range narrow as you add more trades.
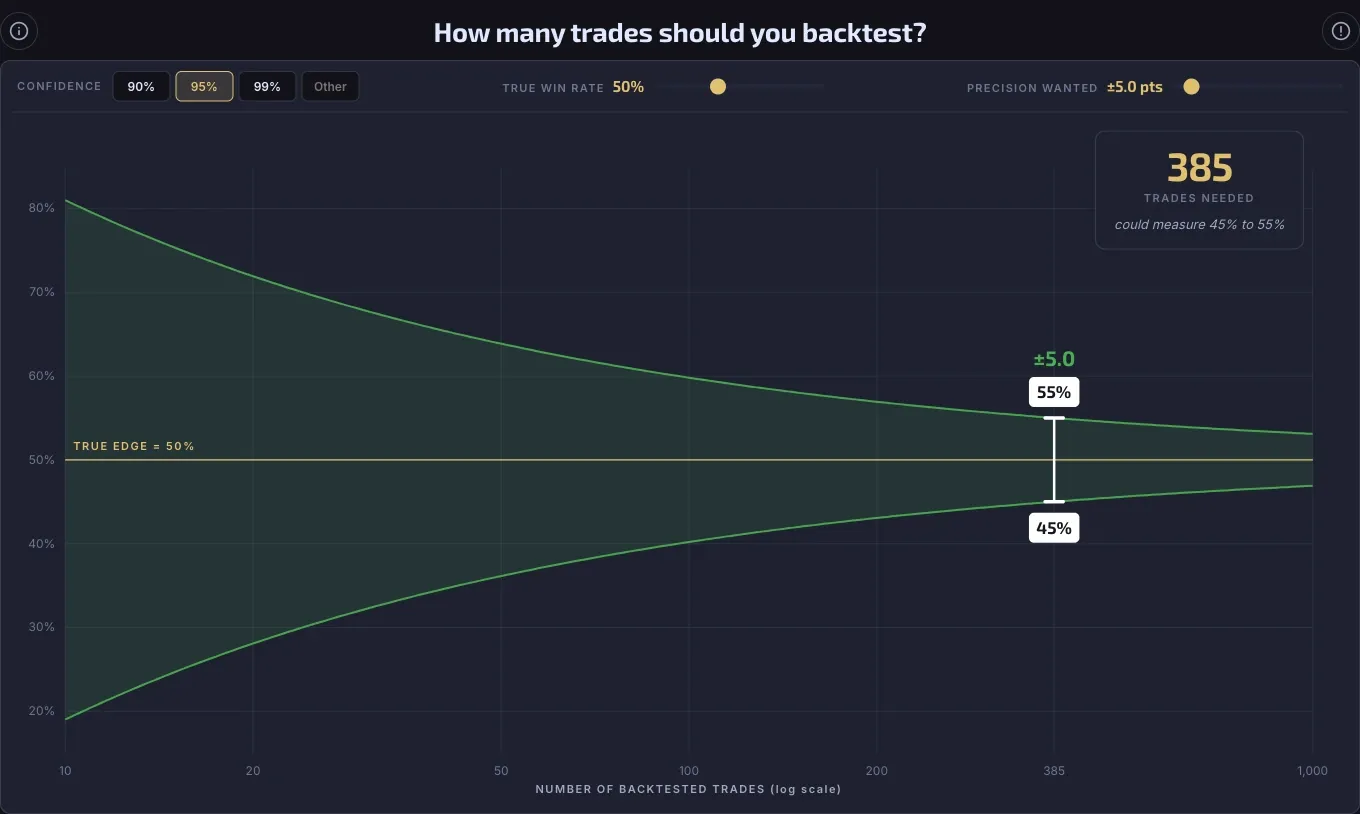
The number can become so large because the range shrinks with the square root of the sample size. Cutting your uncertainty in half costs four times the amount of trades. Going from ±10 points to ±5 takes you from 97 trades to 385. If you keep chasing the range to ±2, it takes 2,401 trades. Nothing else shortens that range. Not more screen time, not a cleaner-looking equity curve, not conviction. Only doing more trades.
About 385 is a good target. At that size the range is no longer enormous, and past it the returns fade fast. Going from 385 to 1,068 trades buys two more points of precision for nearly three times the work.
How close you can get depends on how you test.
Fully automated. If your rules run in code, there is no reason to stop short of 385 trades, because 500 takes about as long as 100. If you do not have that many trades, the answer is more data: go back more years, or add more instruments.
Manual. Doing it by hand is slow, so you may reasonably settle for less. Triple digits should be your minimum target. A smaller sample just means a wider range, and that is fine as long as you know that’s the range you are accepting.
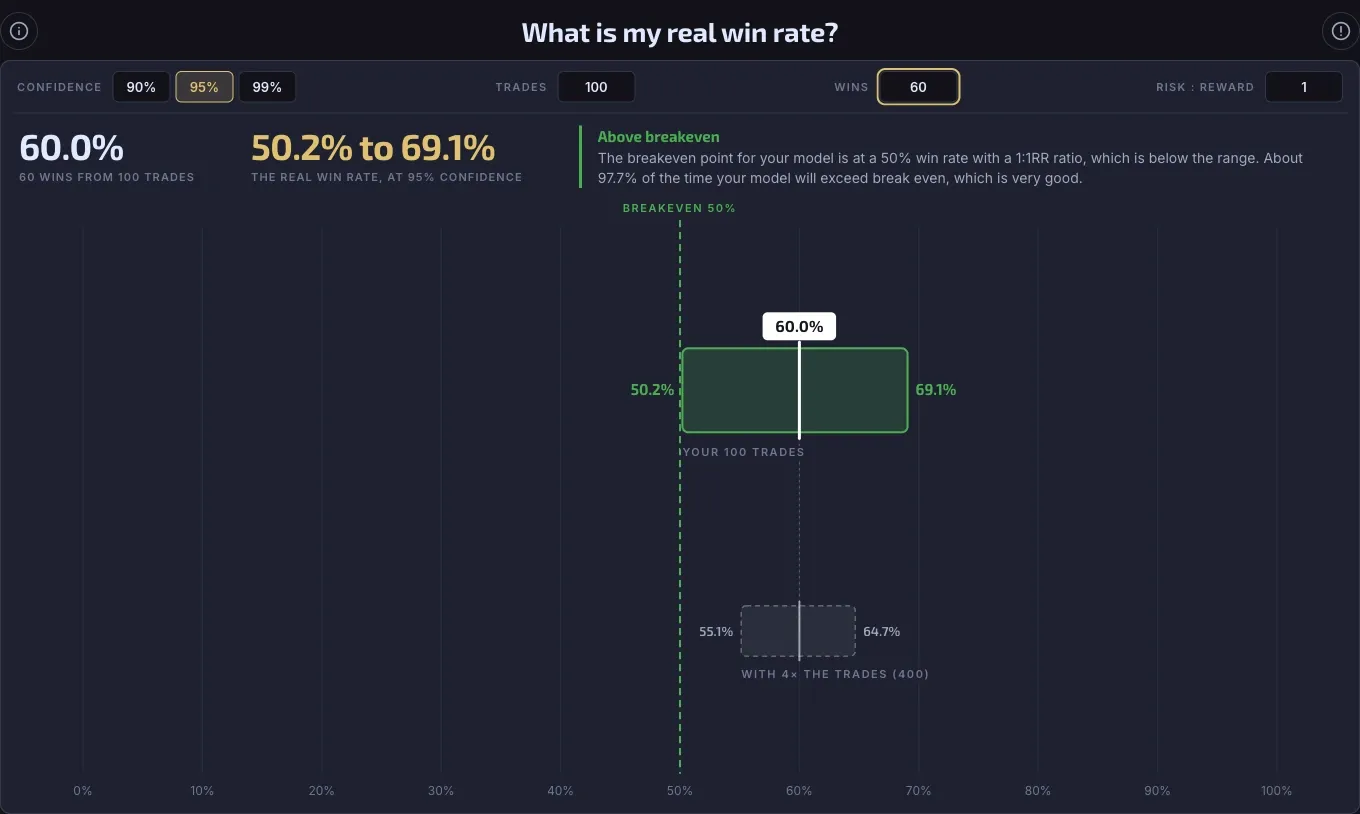
Note that at 100 trades the margin of error is at most ±9.8 points. This means 60 wins from 100 gives a win rate range of 50.2% to 69.1%. At the very worst, that only just clears a coin flip and is not 100% conclusively a profitable model yet. You can visually see this example below.
If you can imagine, this is where going the manual route hurts significantly. Performing hundreds of trades, each judged and recorded identically by hand, is a very slow and tedious process. The work only grows if you want to test a variation of it or backtest the model on a different asset.
This is exactly why BacktestingLab is being built. It will allow you to significantly speed up your strategy development and backtesting. You develop automated rules, and the software does the hard work of finding every occurrence for you. Discretionary traders can then add as much of their own judgment as they want, all the way up to every single trade.
Since the rules always run automated and on their own, you can compare your statistics with and without your own discretionary judgment. Either your calls add a real edge to the model or they take it away. It is meant to fully work for both automated and discretionary traders alike.
Is your win rate above breakeven?
A reliable win rate still does not tell you whether your strategy will make money or not. That depends on how much you win when you win compared with how much you lose when you lose. This is known as the risk-to-reward ratio, written as R or RR.
The breakeven win rate is 1 / (1 + R). At 1:1RR you need 50%. At 2:1RR you need 33.3%, and at 3:1RR you need 25%. At 0.5:1RR you need 66.7%. A beautifully measured 55% win rate can still belong to a losing system if you only win 0.7 for every 1 you risk. The win rate calculator draws this line for you when you fill in its risk:reward field.
Costs move the line
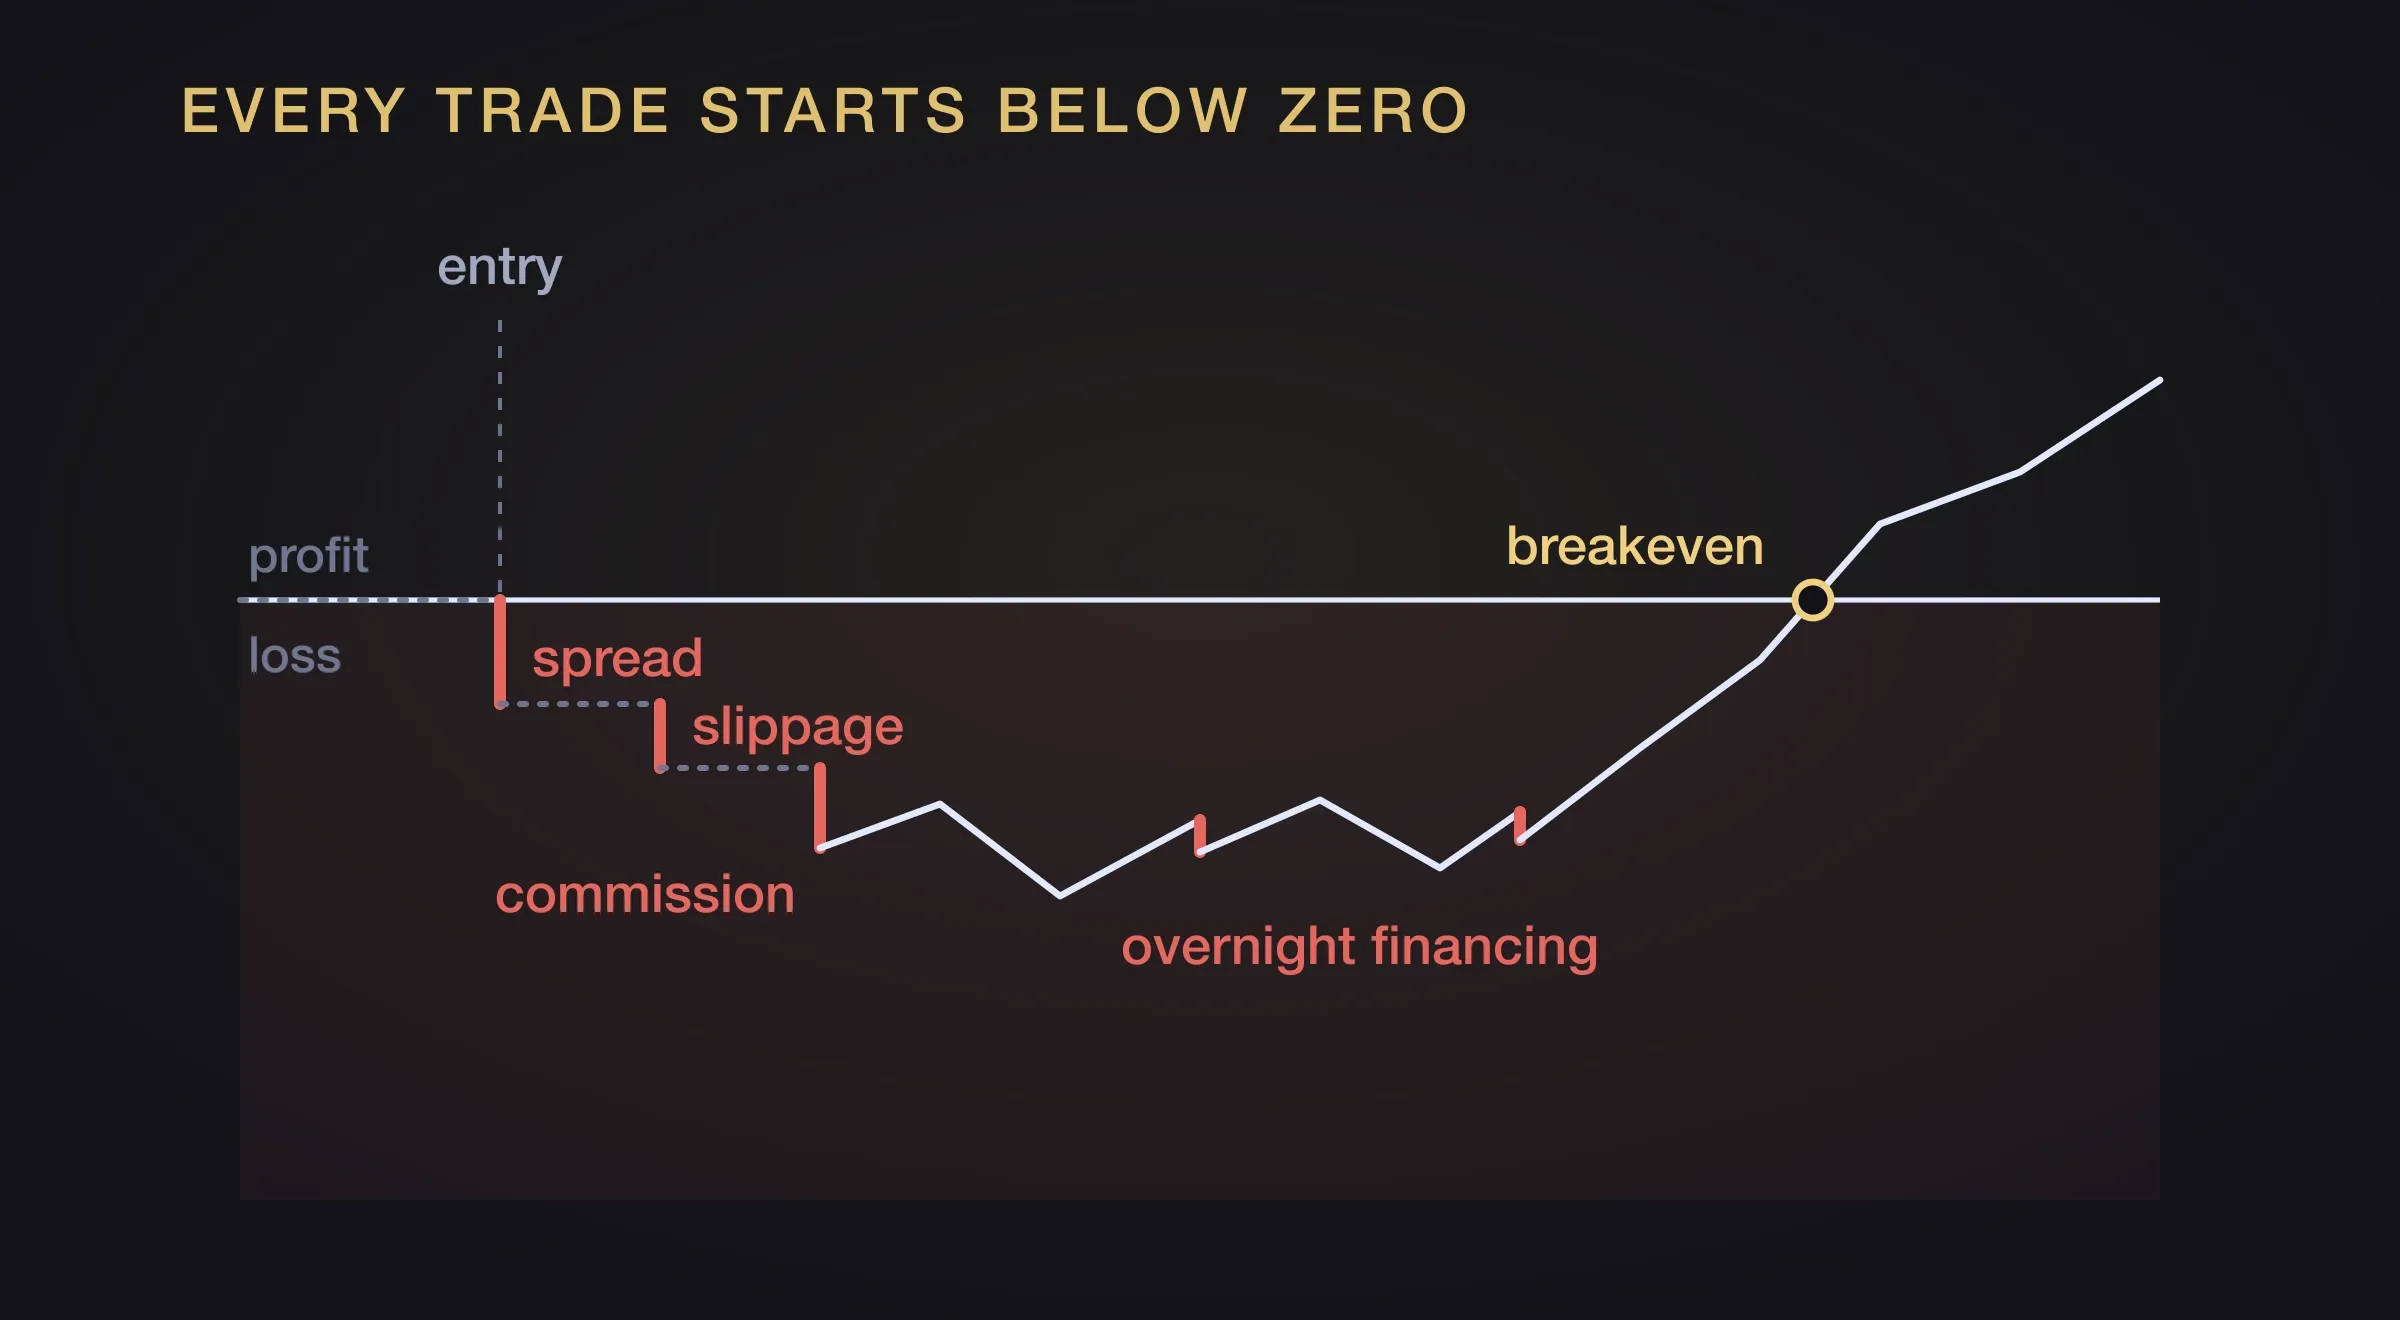
Every trade you enter always starts out as a loser.
It has to. Every trade usually has a fixed cost that you have to pay. This cost comes from either the spread, a commission, and possibly slippage or a combination of these and all before price has even moved.
Let’s call the round-trip cost c, measured as a percentage of the amount you risk. If you risk $100 on a trade and spread, slippage and commission take $10 of it, c is 10%. Then the breakeven win rate becomes (1 + c) / (1 + R), which lifts the line by c / (1 + R). In those two formulas c is written as a decimal, so 10% is 0.1.
What is a fair c value to assume? There is no single number, because it solely depends on your broker’s fees and on how tight your stop loss is. The same fee can be a much bigger share of a tight stop or a small position. This table works it out for four possible ways brokers may charge.
| Cost structure | Example | Your stop or risk | Cost as a percentage of the amount risked (c) |
|---|---|---|---|
| Spread only, on an index | 1.5 points of spread | 20-point stop | 7.5% |
| 50-point stop | 3% | ||
| 100-point stop | 1.5% | ||
| Spread only, on a stock | 3 cents of spread on a $10 stock | 1% stop ($0.10) | 30% |
| 3% stop ($0.30) | 10% | ||
| 5% stop ($0.50) | 6% | ||
| Commission only | $7.50 per side, $15 round trip | $100 risked | 15% |
| $250 risked | 6% | ||
| $500 risked | 3% | ||
| $1,000 risked | 1.5% | ||
| Spread plus a fee | €1 per side, €2 round trip, spread on top | €50 risked | 4% plus the spread |
| €250 risked | 0.8% plus the spread |
Look at the pattern. A tight stop or a small amount risked makes the same fee a much bigger share of each trade. Costs run from about 1% to 30% of the amount risked on ordinary setups. A wide-stop index trade barely notices them, while a tight-stop trade on a stock with a wide spread can lose 30% of the amount risked before the trade has even moved.
You should work out your own costs directly from your broker’s fees and your risk appetite. The 10% used in this guide later on is a middle value, and not a set rule.
If you hold positions overnight on a margin or leveraged account, as a swing trader does, you also need to add the overnight holding charge for every night you hold onto it. This rate differs for long and short positions, and it can be anything from a fraction of a percent to several percent. It is advised to read your broker’s cost structure and fold it into c. Options carry different costs again and are outside of this guide.
Here is the breakeven win rate for each risk-to-reward ratio at each cost level.
| Cost (c), as a percentage of the amount risked | 0.5:1 | 1:1 | 2:1 | 3:1 |
|---|---|---|---|---|
| 0% (no costs) | 66.7% | 50.0% | 33.3% | 25.0% |
| 5% | 70.0% | 52.5% | 35.0% | 26.3% |
| 10% | 73.3% | 55.0% | 36.7% | 27.5% |
| 20% | 80.0% | 60.0% | 40.0% | 30.0% |
| 30% | 86.7% | 65.0% | 43.3% | 32.5% |
At 1:1RR, a cost of 10% means you need 55%, not 50%, to break even. The win rate that looked like a coin flip now loses money.
Expectancy and profit factor
Two statistics sum this up. Expectancy is the average result per trade, measured in R: win rate × R − (1 − win rate) − c. Positive means the strategy makes money across enough trades. Profit factor is gross profit divided by gross loss. A profit factor of 1.0 is breakeven, and anything above 1 is profitable.
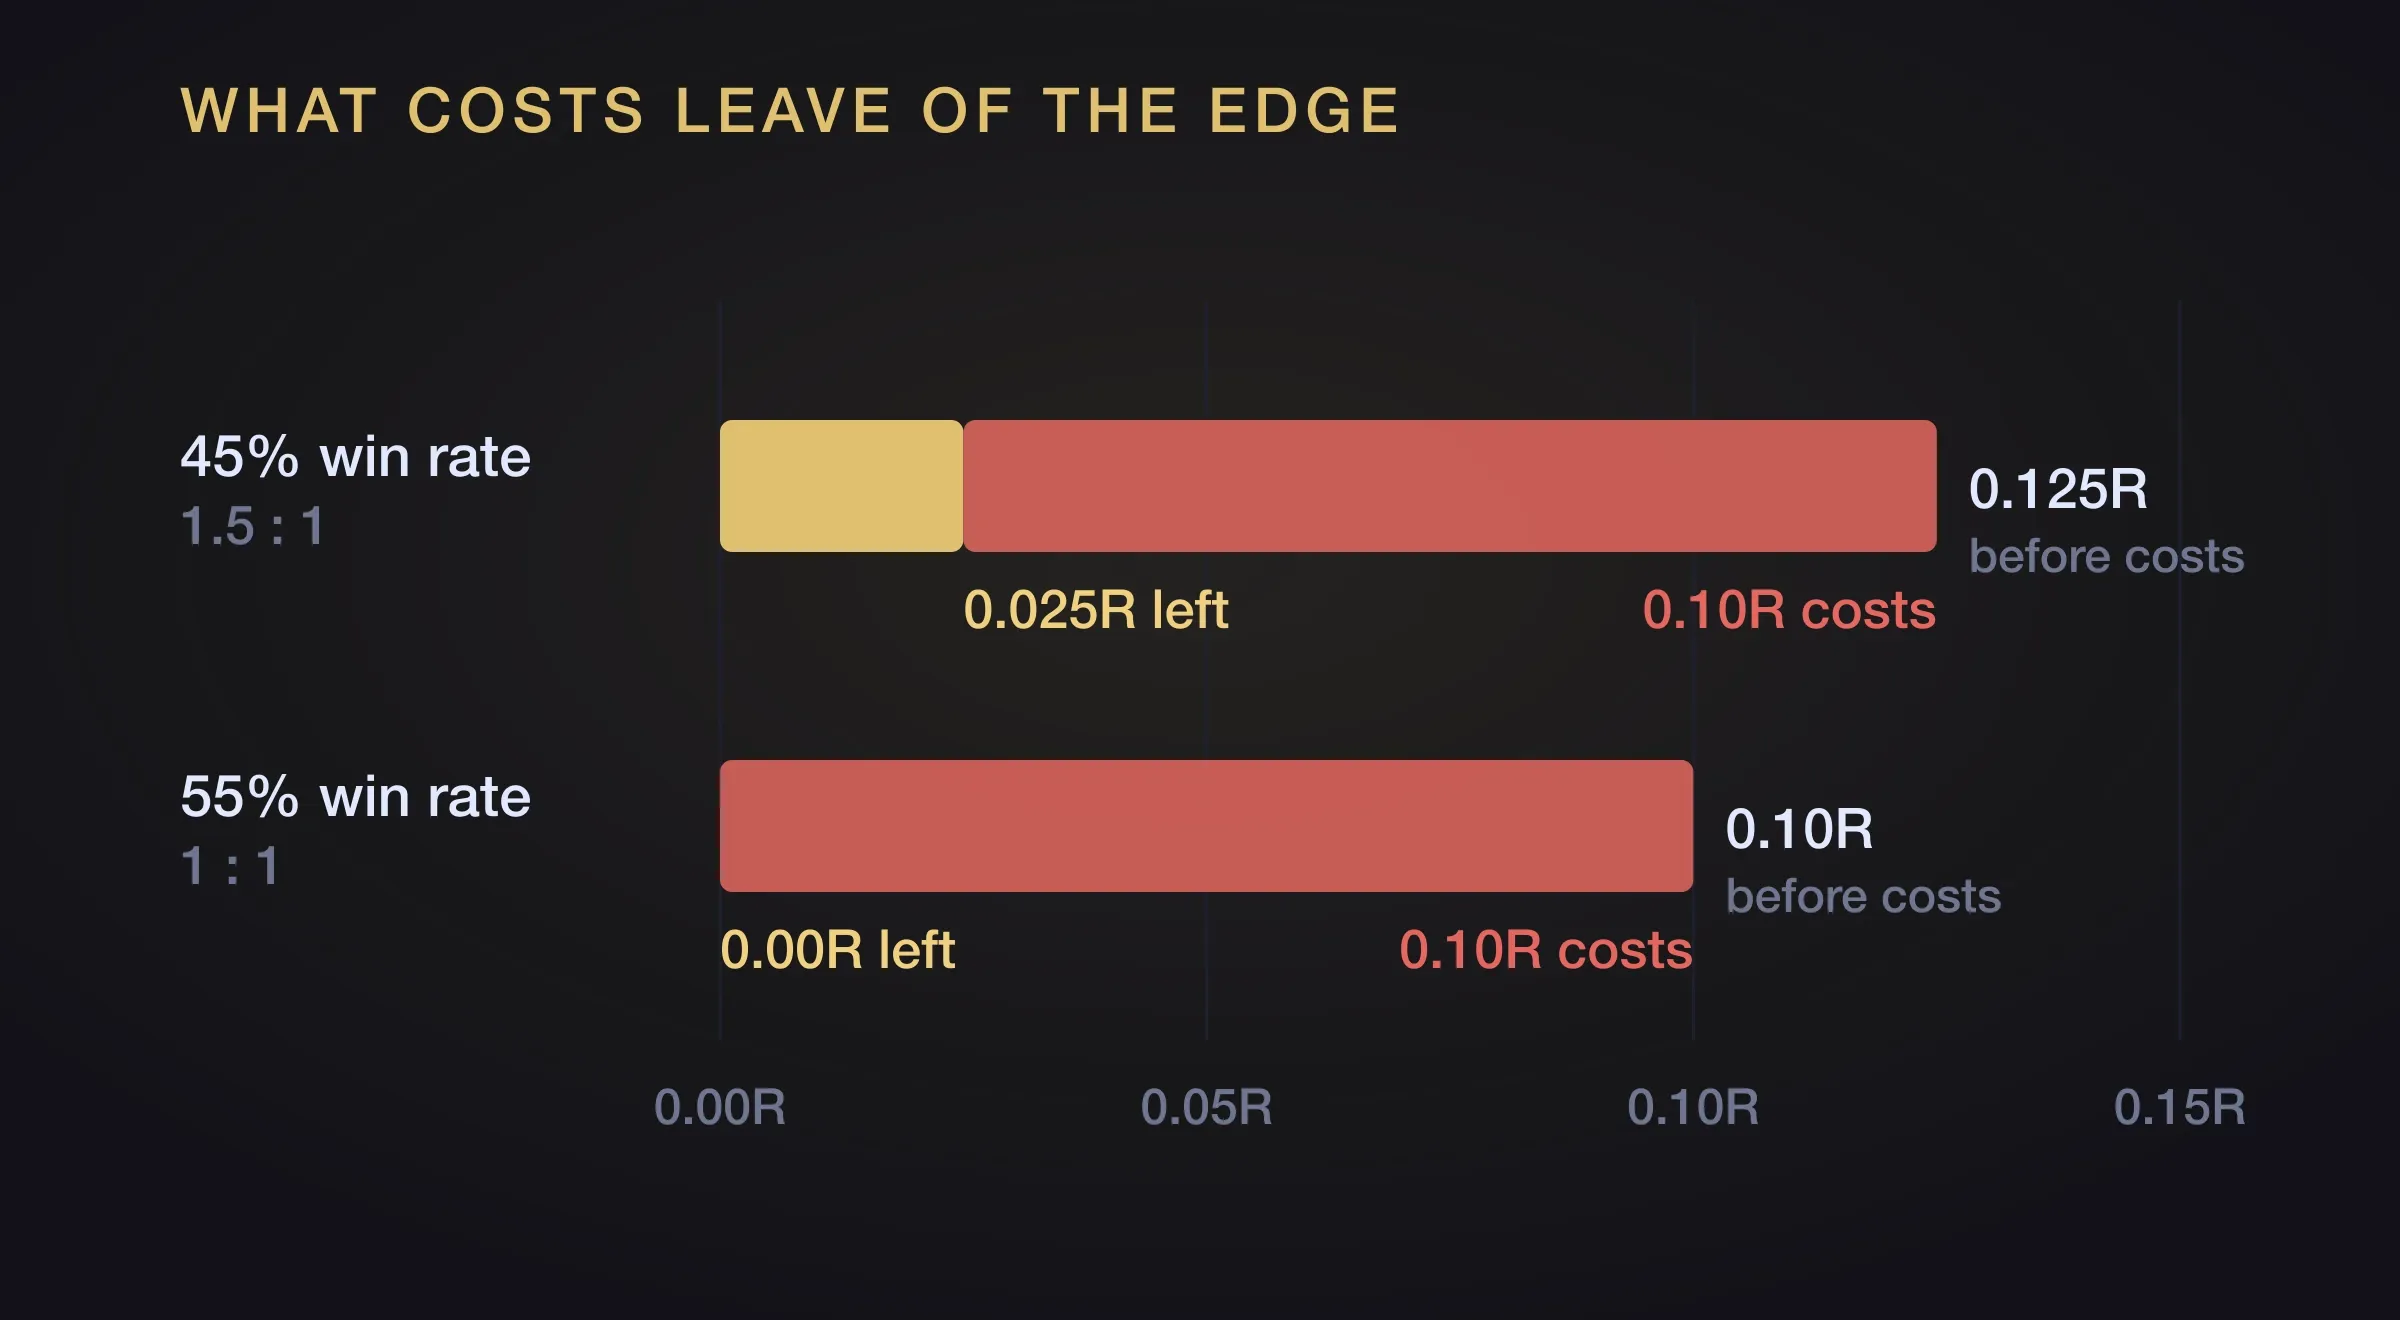
Costs can eat most of an edge. A 45% win rate at 1.5:1RR has an expectancy of +0.125R and a profit factor of 1.23 before costs. With costs at 10% of the amount risked (c = 0.1) that falls to +0.025R and 1.04. Costs end up eating 80% of the edge. A 55% win rate at 1:1RR starts at +0.10R and a profit factor of 1.22, and with the same cost it lands at exactly 0.00R and 1.00.
A model that looked profitable ends up making nothing.
Why do backtests fail in live trading?
A backtest that looks good and then falls apart live usually did one of these five things.
It tested only one market condition in the dataset
Thirty, forty or fifty trades taken inside of one trend is a sample of that trend, and not of the overall strategy. A strategy that thrives in a rising market can struggle in consolidation or reversal, and the other way around.
Market conditions can also shift with things like interest rate cycles or a money rotation from one sector to another. And then there are one-off events (also known as a black swan), such as a war starting, a company going bankrupt or a sharp move over several days of bad reported earnings. These ‘events’ can land inside your backtest sample by luck and skew it either in your favour or against you.
The win rate range assumes your trades are independent of each other, and trades from one stretch of market are not. So treat a range from a single stretch as the best case for your uncertainty, never the worst. Test across years and through different market conditions.
It stopped working because the market conditions changed
Traders call it edge decay when a strategy that worked stops working. Often the strategy has not broken. It works under certain market conditions, and the conditions have changed. That does not make the model garbage, and it is no promise it will work again, but it does mean a model can come back when the conditions it likes return.
Either way, one backtest is a snapshot. Keep comparing your backtest, forward test and live results. If they stop agreeing, you or the market have changed something, and that is your cue to re-check, not to panic.
It knew what happened next (lookahead bias)
You already know what price did next. In a manual backtest it is easy to award yourself entries you would never have taken live, and to sit through a drop you would have bailed on.
Replay also hides some of the pressure. Watching a candle build in real time with a big move against you is a different experience from clicking forward to the next finished candle. A replay can model that only if it runs on tick data, where every price change is kept, or also on sub-minute data.
With one-minute candles you press play, see the big candle, and carry on calmly, whereas under live conditions you might chase the move or abandon your plan. A rules-based test avoids part of the problem, because it finds setups without knowing what comes next.
It ignored fills and spreads
A backtest usually assumes you get the price on the chart. Live, market orders slip, sometimes in your favour and sometimes not. A limit order can be touched by price and still not fill, so the trade your backtest took never happens. Spreads widen when volatility rises or at quieter times of day, and an asset with thin volume may not let you trade the size you assumed. These add up to the cost c from the last section, so you need to build them in.
It was tweaked (overfitted) until the past fit
Adjust the rules enough on one stretch of data and they will fit that stretch perfectly and little else. Traders call it overfitting. The fix is plain: keep some data you have not looked at, run your finished rules on it once, and see whether the result still holds. That is called walk-forward testing using out-of-sample data. If it holds, good. If it falls apart, the rules were too fitted to the past.
How do you know your strategy still works?
Your first few trades prove very little. A strategy with a true 55% win rate wins 3 or fewer of its first 10 trades about 1 time in 10 or 10.2% of the time. At a true 50% it happens about 1 time in 6 or 17.2% of the time. So a start of 7 losses from 10 is a normal bad start, not evidence that the model is broken, and the traders who quit there never find out.
The antidote is to decide your tolerances before you trade. Your backtest tells you the longest losing streak and the biggest drawdown the strategy produced. A run inside those numbers is variance. A run beyond them is a reason to re-check. Compare a rolling window, say the last two weeks or the last month, with your backtest. If the statistics are drifting, test again on fresh data before you touch your rules.
Most of the issues here are human factors: paranoia after a losing streak, second-guessing your model, changing the rules halfway through a run, and not trusting the statistics over the long run. The data only helps if you follow it exactly.
Is backtesting worth it?
Some traders say to skip it and just forward test, demo trade or learn from live trading, because you cannot really learn unless real money is on the line. Others try backtesting once, watch a result fall apart live, and call it a scam. Both are wrong, and both usually come from doing it badly or skipping the work.
A backtest done properly is the cheapest answer you can buy. It costs no money (apart from the backtesting software and/or historical datasets you buy) and causes no emotional damage. On top, it can be done quickly.
It lets you test and explore strategies until you find one that actually works, and it tells you whether you can expect to make any money from trading it at all. If you cannot find a profitable strategy on historical data, then there is no point in trying to become a trader. Why wouldn’t you want to know whether your strategy is even profitable before you start risking real money?
Demo and live trading do other jobs. Demo trading is where you practise spotting your setup under live conditions and get comfortable placing trades and watching money go up and down. Live trading is the same, but with your own money on the line. Neither is a good way to efficiently measure a strategy, because they are far too slow. At five trades a week, 385 trades takes about a year and a half.
Trading without a strategy, or without knowing its numbers, is the real mistake: the profit factor, the expectancy, the win rate, the longest losing streak, the risk-to-reward ratio, where the stop loss and the take profit go. A backtest is how you get all these numbers and points. And when a backtested strategy fails live, the cause is almost always one of the five above, not backtesting itself.
When are you ready to move on?
There is no one threshold, and this guide will not invent one. Your experience, your tolerance for pain and the way you learn are all different. Some traders do badly when they are failing, and others get motivated to find a better way.
If you are comfortable with your sample size, happy with the win rate and the profit factor, and your odds of sitting above breakeven look good, and you feel ready, nobody should stop you because you have not reached an arbitrary number. You know yourself best.
What this guide will say is what not to do. Do not run 40 or 50 trades, see an 80% or 90% win rate and go straight to live trading. That is how people end up hurt by a model that was never properly tested.
The usual sequence runs from backtesting to walk-forward testing on historical data you have not looked at, then forward testing, where you watch for your setup to form for a period of time and confirm you can spot it. Next comes demo or paper trading, and then live.
Where this fits
Backtesting is the second of five stages, and this guide is only about whether to trust its results. Learning the approach comes before it, and forward testing, paper trading and going live come after.
If you want the wider path, the five stages from learning an approach through to trading it live are laid out in how to become a profitable trader.